Using Laravel Tinker in Chrome DevTools
Tony Lea created a new Chrome extension that will add a PHP tab in Chrome DevTools. Nice!
Read more [amitmerchant.com]
Posts tagged with debug
Tony Lea created a new Chrome extension that will add a PHP tab in Chrome DevTools. Nice!
Read more [amitmerchant.com]
– youtu.be - submitted by Bert De Swaef
In this video we're learning how to use Ray to debug your projects. Weither your working with Laravel, PHP, Javascript or some other programming language, Ray is there for you.
Debugging your project was made easy by the guys over at Spatie. They designed and developed a debugging tool for us, called Ray. Available at https://myray.app
Read more [youtu.be]
Join 9,500+ smart developers
Get my monthly newsletter with what I learn from running Spatie, building Oh Dear, and maintaining 300+ open source packages. Practical takes on Laravel, PHP, and AI that you can actually use.
No spam. Unsubscribe anytime. You can also follow me on X.
"Always fresh, useful tips and articles. Carefully selected community content. My favorite newsletter, which I look forward to every time."
– github.com - submitted by Patrick
The vue-ray package has released v2.0, with full script setup/composition api support, reduced overhead, and more.
Read more [github.com]
– flareapp.io - submitted by Spatie
Learn how to improve your debugging experience with custom context and glows.
Read more [flareapp.io]
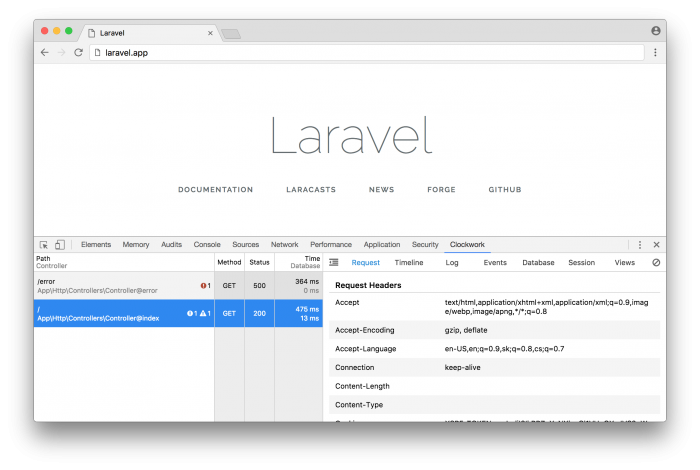
– qirolab.com - submitted by Harish Kumar
Laravel Clockwork is a powerful debugging and profiling tool seamlessly integrated into the Laravel framework. With its real-time web interface, Clockwork provides developers with instant insights into their application's runtime behavior.
Read more [qirolab.com]
There are a few tricks in Chrome DevTools that don’t seem to get enough attention.
Read more [utilitybend.com]
Our handy Ray debugging app gained a cool new trick: it can now display the values of private properties and results of private methods.
I'm proud to share that our team has released a new major version of Ignition, the most beautiful error page for Laravel and PHP. It has been redesigned from the ground up. Here's how it looks like. This error page will be the default in Laravel 9. You can optionally install it into any Laravel 8 or…
If you're using Ignition (and you probably are if you're on Laravel 6), you know have access to a new helper function that help you debug code.
We now give you ddd - a globally available helper function that does everything that you love about dd and sprinkles everything that Ignition has to offer on top of it.
Read more [flareapp.io]
Jonathan Reinink has added a very usefull metric to Laravel debugbar
Last week at Laracon US I gave a talk titled Eloquent Performance Patterns. In that talk I used a custom Laravel Debugbar metric I created to track how many Eloquent models were being hydrated throughout a request. I've had a lot of people asking about this, so today I submitted a pull request to the Laravel Debugbar to add this as an official metric.
Read more [reinink.ca]
If you're debugging an array or an object, try console.table() instead of console.log()! It gives you a muuuuch better visual representation of the data in the console ? pic.twitter.com/5V9TCsBiOK
— Erin ? (@erinfranmc) June 10, 2019
Read more [twitter.com]
Grégoire Pineau explains how you can find the source of a segfault in PHP.
Sometimes, a segfault happens, but you don’t know where, and your PHP installation does not have tools to find it. Or sometime, you think PHP is hanging, but you don’t know where. You may use xdebug, but you don’t want to click so many times on the « next call » button.
Read more [jolicode.com]
Whoops error pages are awesome, though sometimes you may need to analyze stack trace in PhpStorm!
— PhpStorm (@phpstorm) October 19, 2018
Tools -> Analyze Stack Trace
Can also be handy if you got a stack trace from a remote server log. pic.twitter.com/OVRb5KnBJQ
Read more [twitter.com]
Marcel Pociot created another great package. laravel-dump-server will transmit all output of dump calls to another port on your system. This will avoid cluttering up the responses of your app with debug output. Here's a gif taken from the readme of the package:
https://github.com/beyondcode/laravel-dump-server
Joe Watkins, core PHP developer and author of (amongst many other things) ptrheads, is busy creating a PHP debugger written in PHP that you can just composer require.
This isn't just pipe dreams, the PHP code exists, it's alpha quality and largely untested ...There is much to do and you shouldn't design your workflow around this (or any alpha quality software) yet. What you should do is start reading code, testing, and opening pull requests...
You'll find the code of Joe's debugger in this repo on GitHub.
Read more [blog.krakjoe.ninja]
My colleague Sebastian took the time to write down the solution to a problem many artisans will come across at some point in time. I hope that in a future version of Laravel that error message will be improved so that it makes clear what the actual problem really is.
Every now and then I come across a Class log does not exist exception in Laravel. This particular exception is thrown when something goes wrong really early in the application, before the exception handler is instantiated.Whenever I come across this issue I'm stumped. Mostly it's related to an invalid configuration issue or an early service provider that throws an exception. I always forget how to debug this, so it's time to document my solution for tracking down the underlying error.
Clockwork is Laravel package, made by itsgoingd, that can collect a lot of helpful info such as queries executed, views loaded, route used, ... Unlike the popular laravel-debugbar package, Clockwork will not inject extra stuff into the html itself. All collected info is displayed in the developer tools of your browser (you'll need to install an extension first).
On most of my day to day work I use Laravel Valet to develop locally. When hitting a bug often I just put a dd() statement in the code to quickly inspect what's going on. But when encountering a complex bug this becomes tedious. Wouldn't it be nice if we could add a breakpoint to our code and be…
Pedro Sanchez wrote a good guide on how to get started with Xdebug in PhpStorm.
We assume that you use PHPStorm on a daily basis, and this guide will help to debug your code locally using the IDE. A remote debugging guide will come in the future.
http://tech.mybuilder.com/phpstorm-configuring-and-using-xdebug/
The Query Tracer package can help you find out where a specific database query is being called. It works with both Clockwork and the Laravel Debugbar. Here's a screenshot taken from the readme:
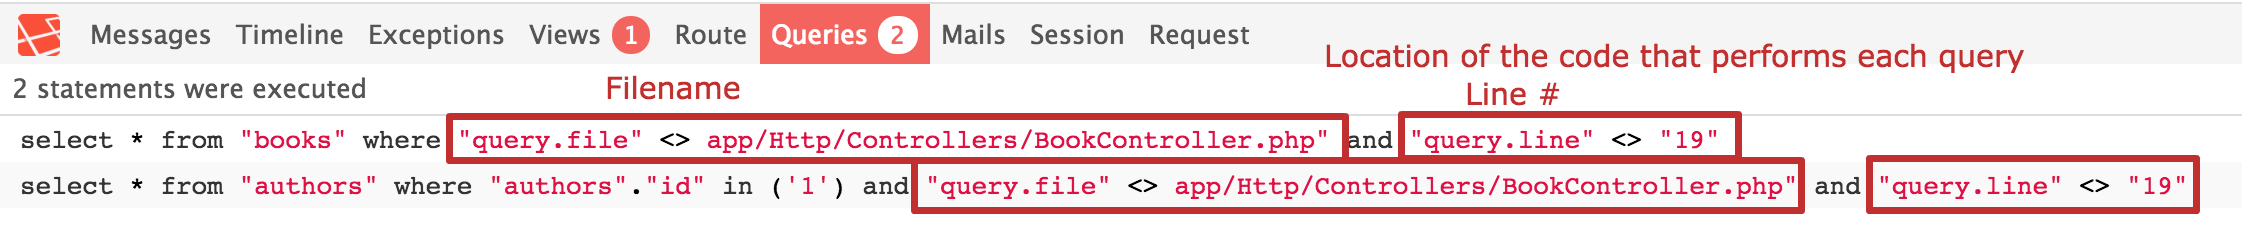
https://github.com/fitztrev/query-tracer
EDIT: turns out that Laravel Debugbar can do this out of the box: