Setting up Xdebug with Laravel Valet original
On most of my day to day work I use Laravel Valet to develop locally. When hitting a bug often I just put a dd() statement in the code to quickly inspect what's going on. But when encountering a complex bug this becomes tedious. Wouldn't it be nice if we could add a breakpoint to our code and be able to inspect the values of all variables in one go (and even execute the script line by line)? Enter Xdebug. In this post I'll show you easy it is to install and use it.
Installing Xdebug
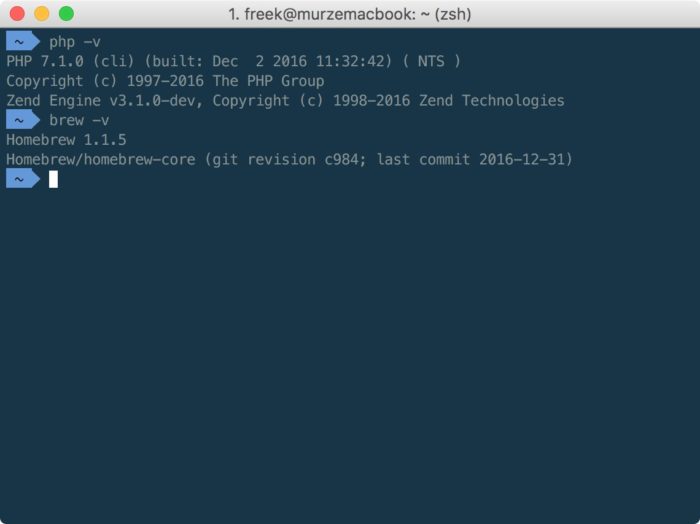
I'm going to assume that you have are running macOS, have latest version of PHP installed together with homebrew.
To install xdebug, just run this command:
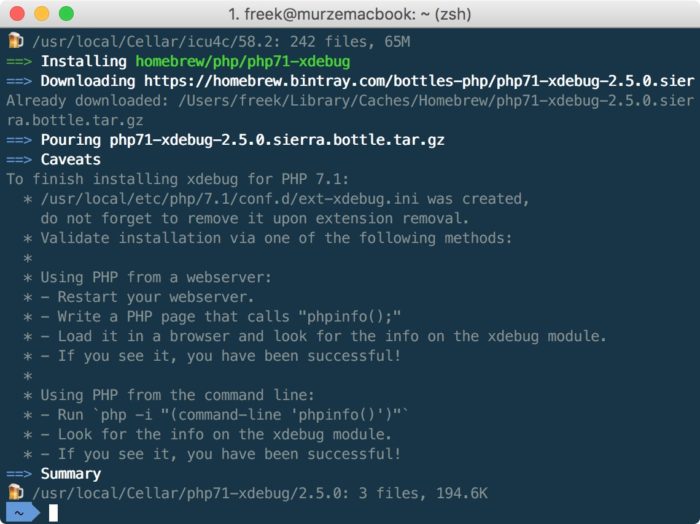
brew install php71-xdebug
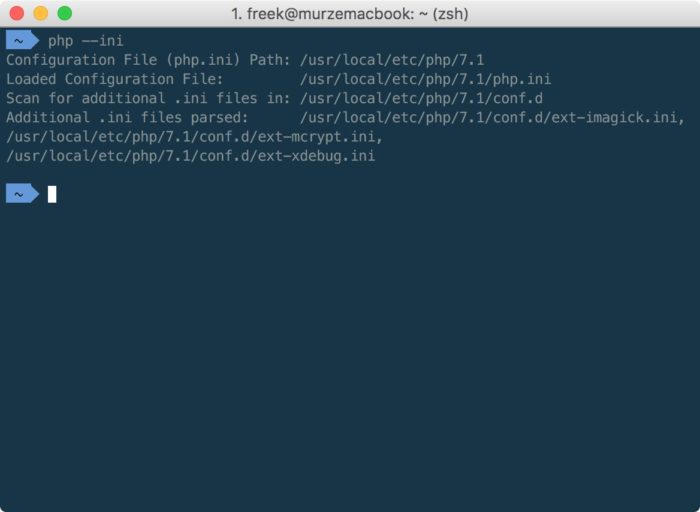
In the last lines of the output of the installation indicated that there's a new ini file created at /usr/local/etc/php/7.1/conf.d/ext-xdebug.ini. By running php --ini you can verify that php is reading that setting file.
Go ahead and add these lines to that file:
xdebug.remote_enable=true
xdebug.remote_host=localhost
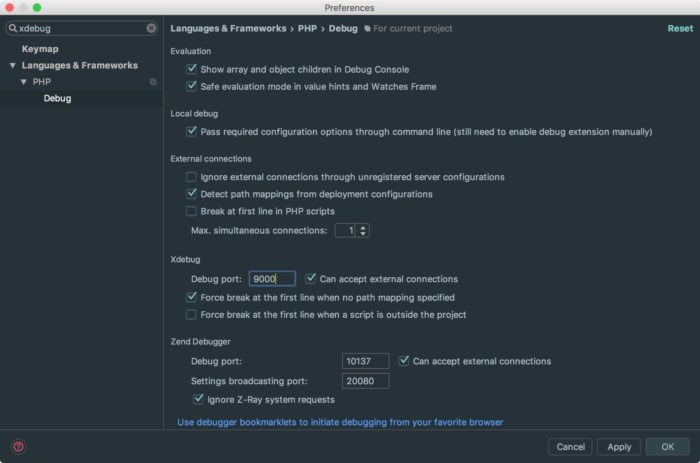
xdebug.remote_port=9000
xdebug.remote_handler=dbgp
The above settings are needed to allow PHPStorm to connect to Xdebug. You can look up the meaning of the individual settings in the xdebug documentation. Port 9000 seems to be the default, but you may choose another port if you like.
Debugging a cli command
If you want to follow along with the rest of this post, create a fresh copy of laravel in a directory you parked with Valet. In my mac I've parked the /Users/freek/dev/sites directory. In that directory I ran laravel new laravel to create fresh copy of Laravel in the laravel directory.
Let's first test out if we can add a breakpoint to a script that is running on the command line. Open up the newly created project in PHPStorm. In the Debug preferences in PHPStorm make sure the debug port is set to the same value you specified in the ini file. Also uncheck "Force break at the first line when a script is outside the project".
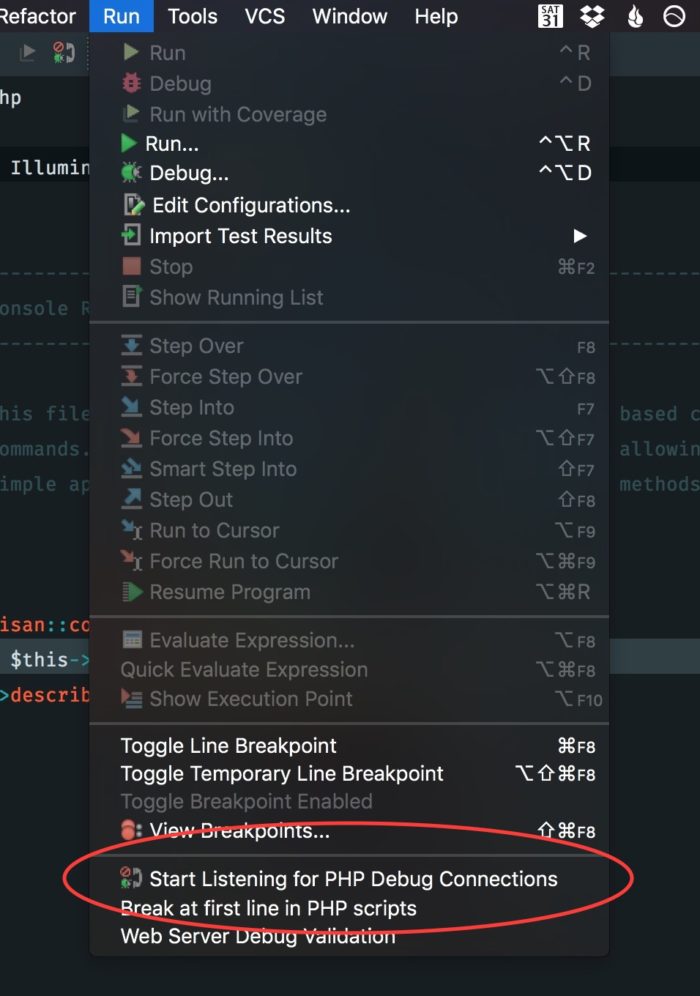
Next up, select "Start listening for PHP Debug Connections" from the "Run" menu.
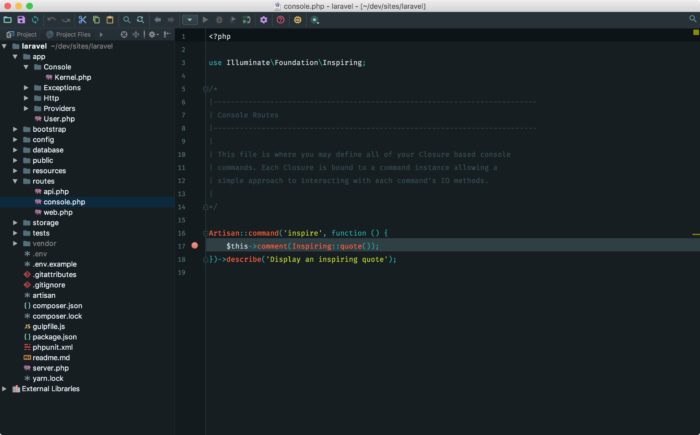
Let's add our first breakpoint. Open up routes/console.php and add a breakpoint by adding click in the sidebar left on the $this->comment(... line.
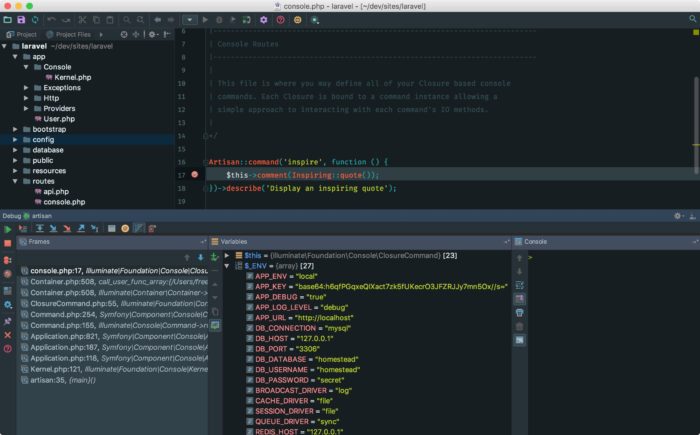
Now let's run the command in which we just place a breakpoint. Got to the command line and execute php artisan inspire. And boom, xdebug should activate.
In the variables pane you can now inspect every single variable in the script. In the console pane you can run arbitrary code. Handy! Explaining the Xdebug UI in PHPStorm is out of scope for this article. Read the PHPStorm docs to know more or just play around with it.
Debugging a web request
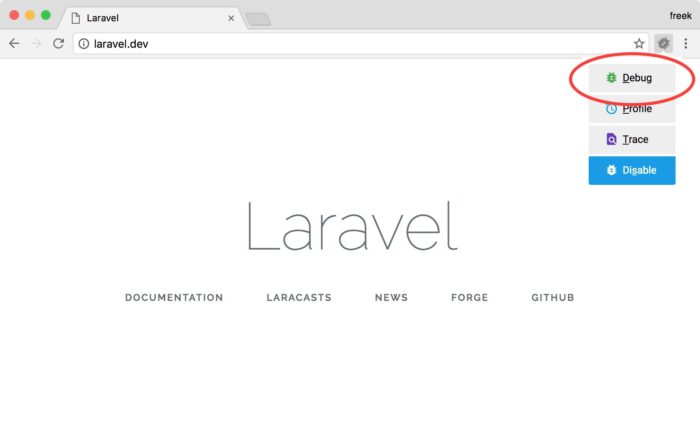
In order to trigger Xdebug a special cookie needs to be set on the webrequest. You can use the bookmarklets provided by Jetbrains to set those cookies. Personally I prefer using the Chrome Xdebug Helper extension.
With the extension installed just point your browser to your site, click on the little bug icon next to the address bar, and choose "Debug".
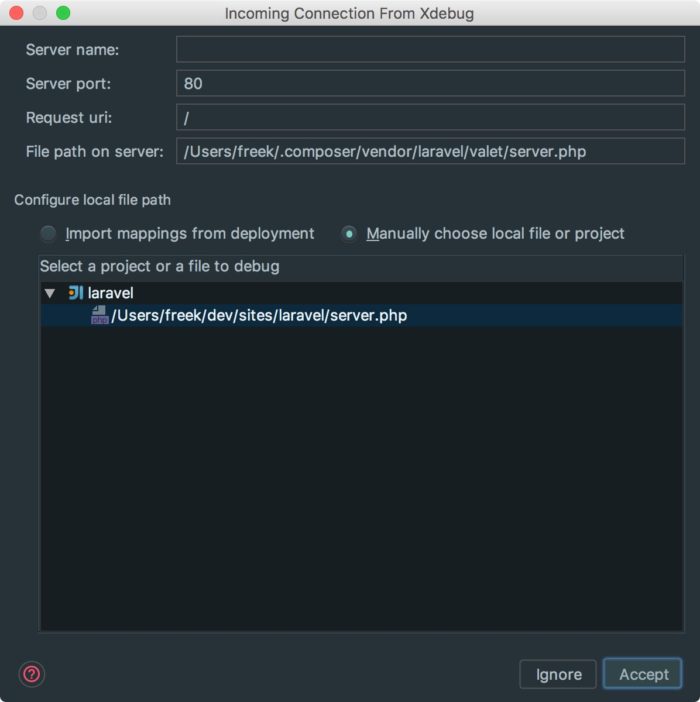
That bug icon should turn green now indicating that the right cookies have been set. Now go to the a piece of code in your project that should run when the web request is performed. In my case I'm going to set a breakpoint in web/routes.php. When refreshing the webpage you should first see this dialog indicating that PHPStorm got an incoming connection from Xdebug.
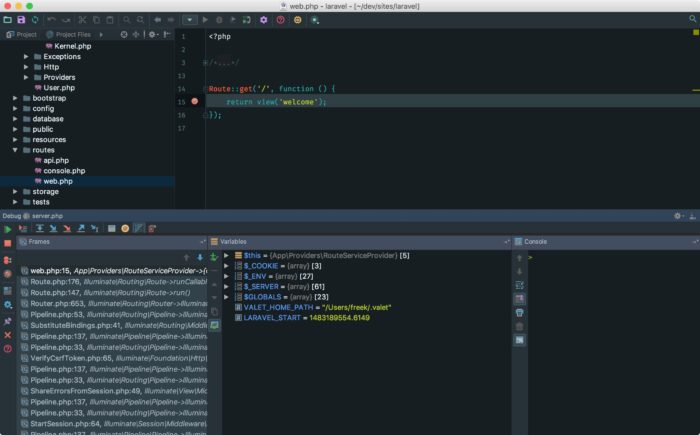
After clicking "Accept" you should hit your breakpoint.
Congratulations on your working Xdebug installation!
A word on performance
With Xdebug enabled your PHP code will run a lot slower. Luckily Djamil Legato coded up an xdebug toggler make it easy to switch xdebug on and off with a single command.
You might see this warning when running composer:
You are running composer with xdebug enabled. This has a major impact on runtime performance.
To solve that just update to the latest version of composer which can automatically detect and temporarily turn off Xdebug while it's running.
If you had trouble following this guide, you might take a look at this video by Gary Hockin. He dives a little bit deeper in the Xdebug integration in PHPStorm.
Happy debugging!
