Building a realtime dashboard powered by Laravel, Vue, Pusher and Tailwind (2018 edition) original
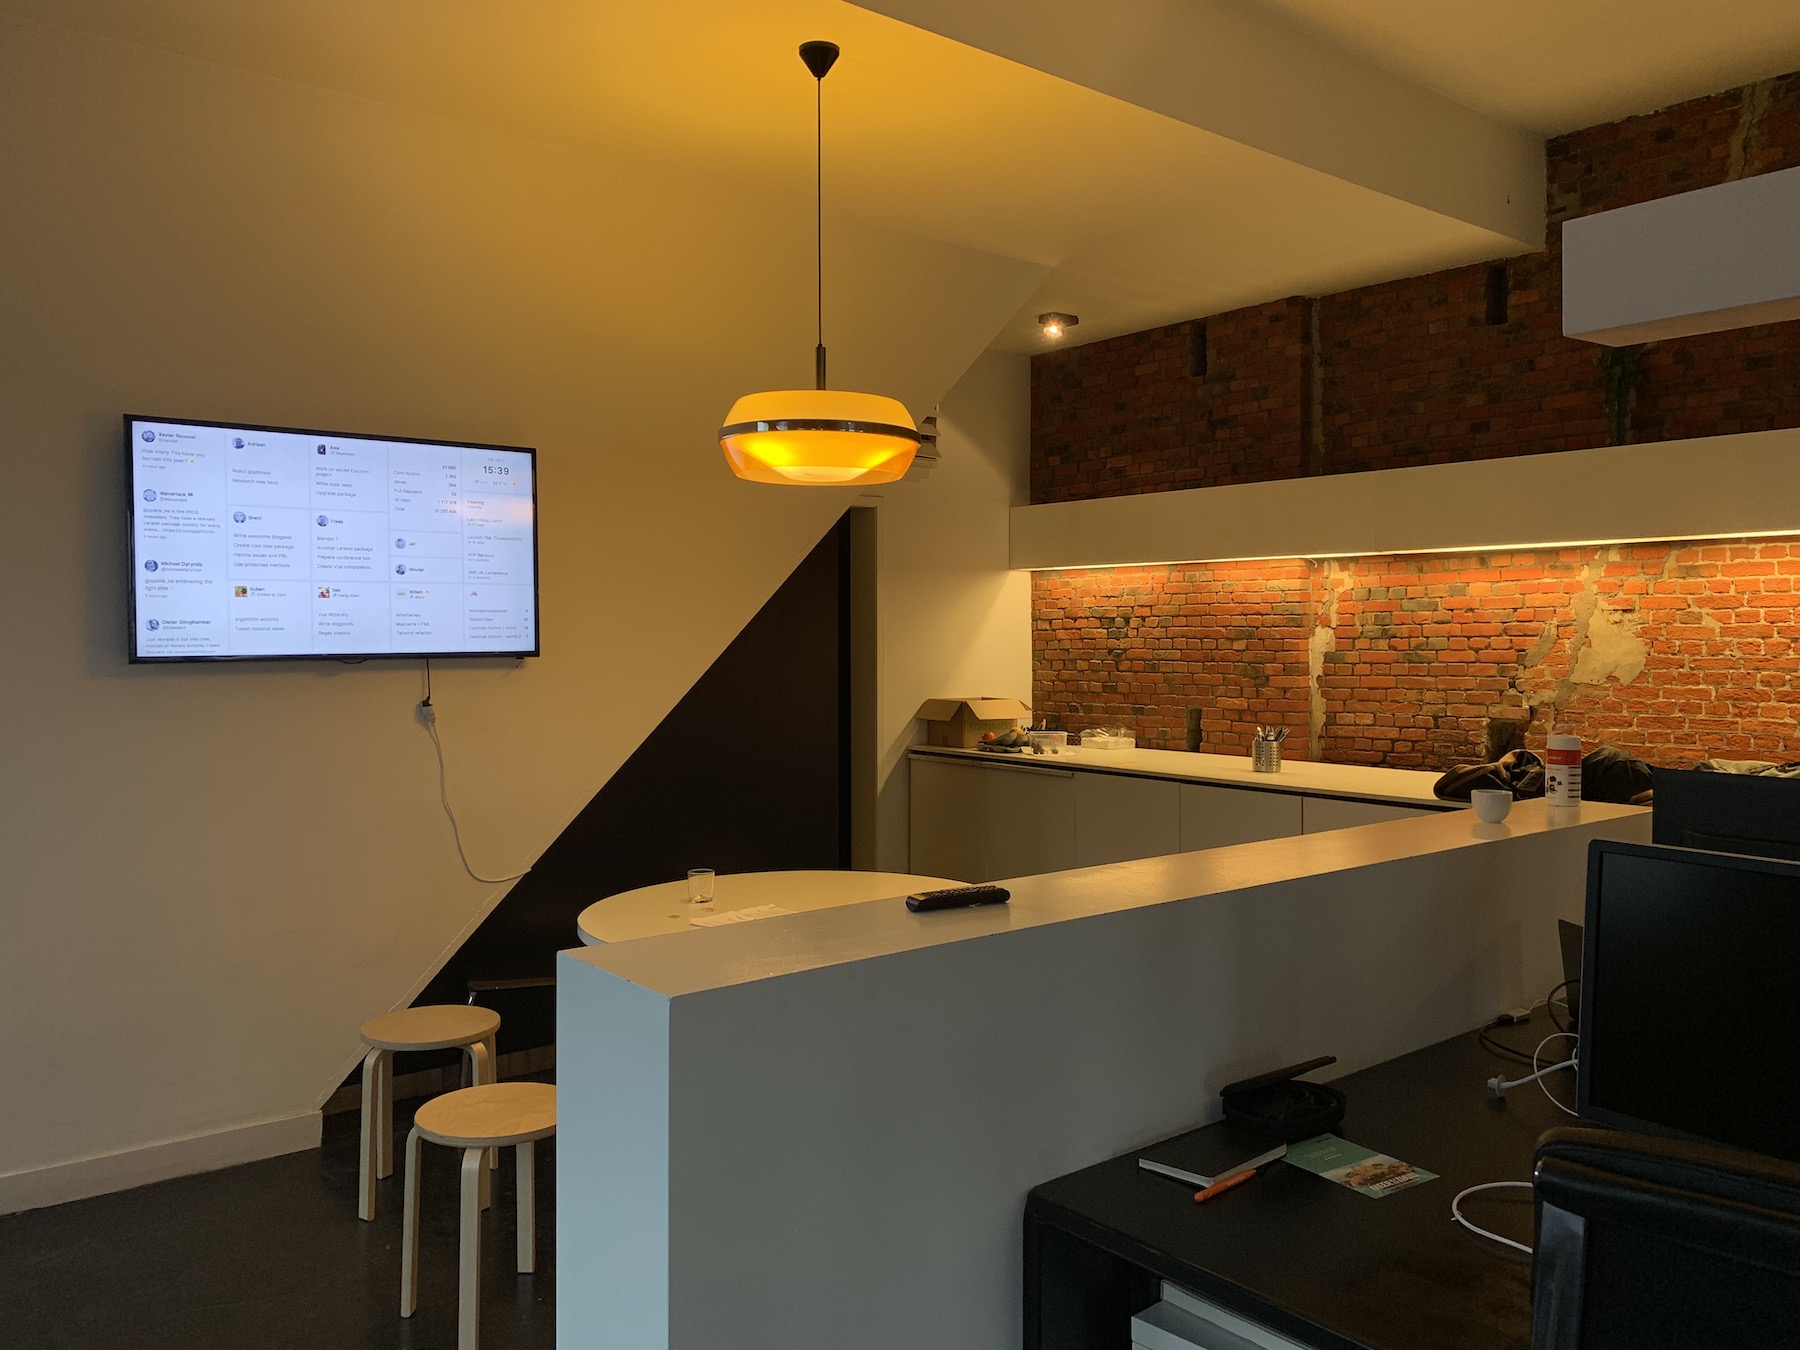
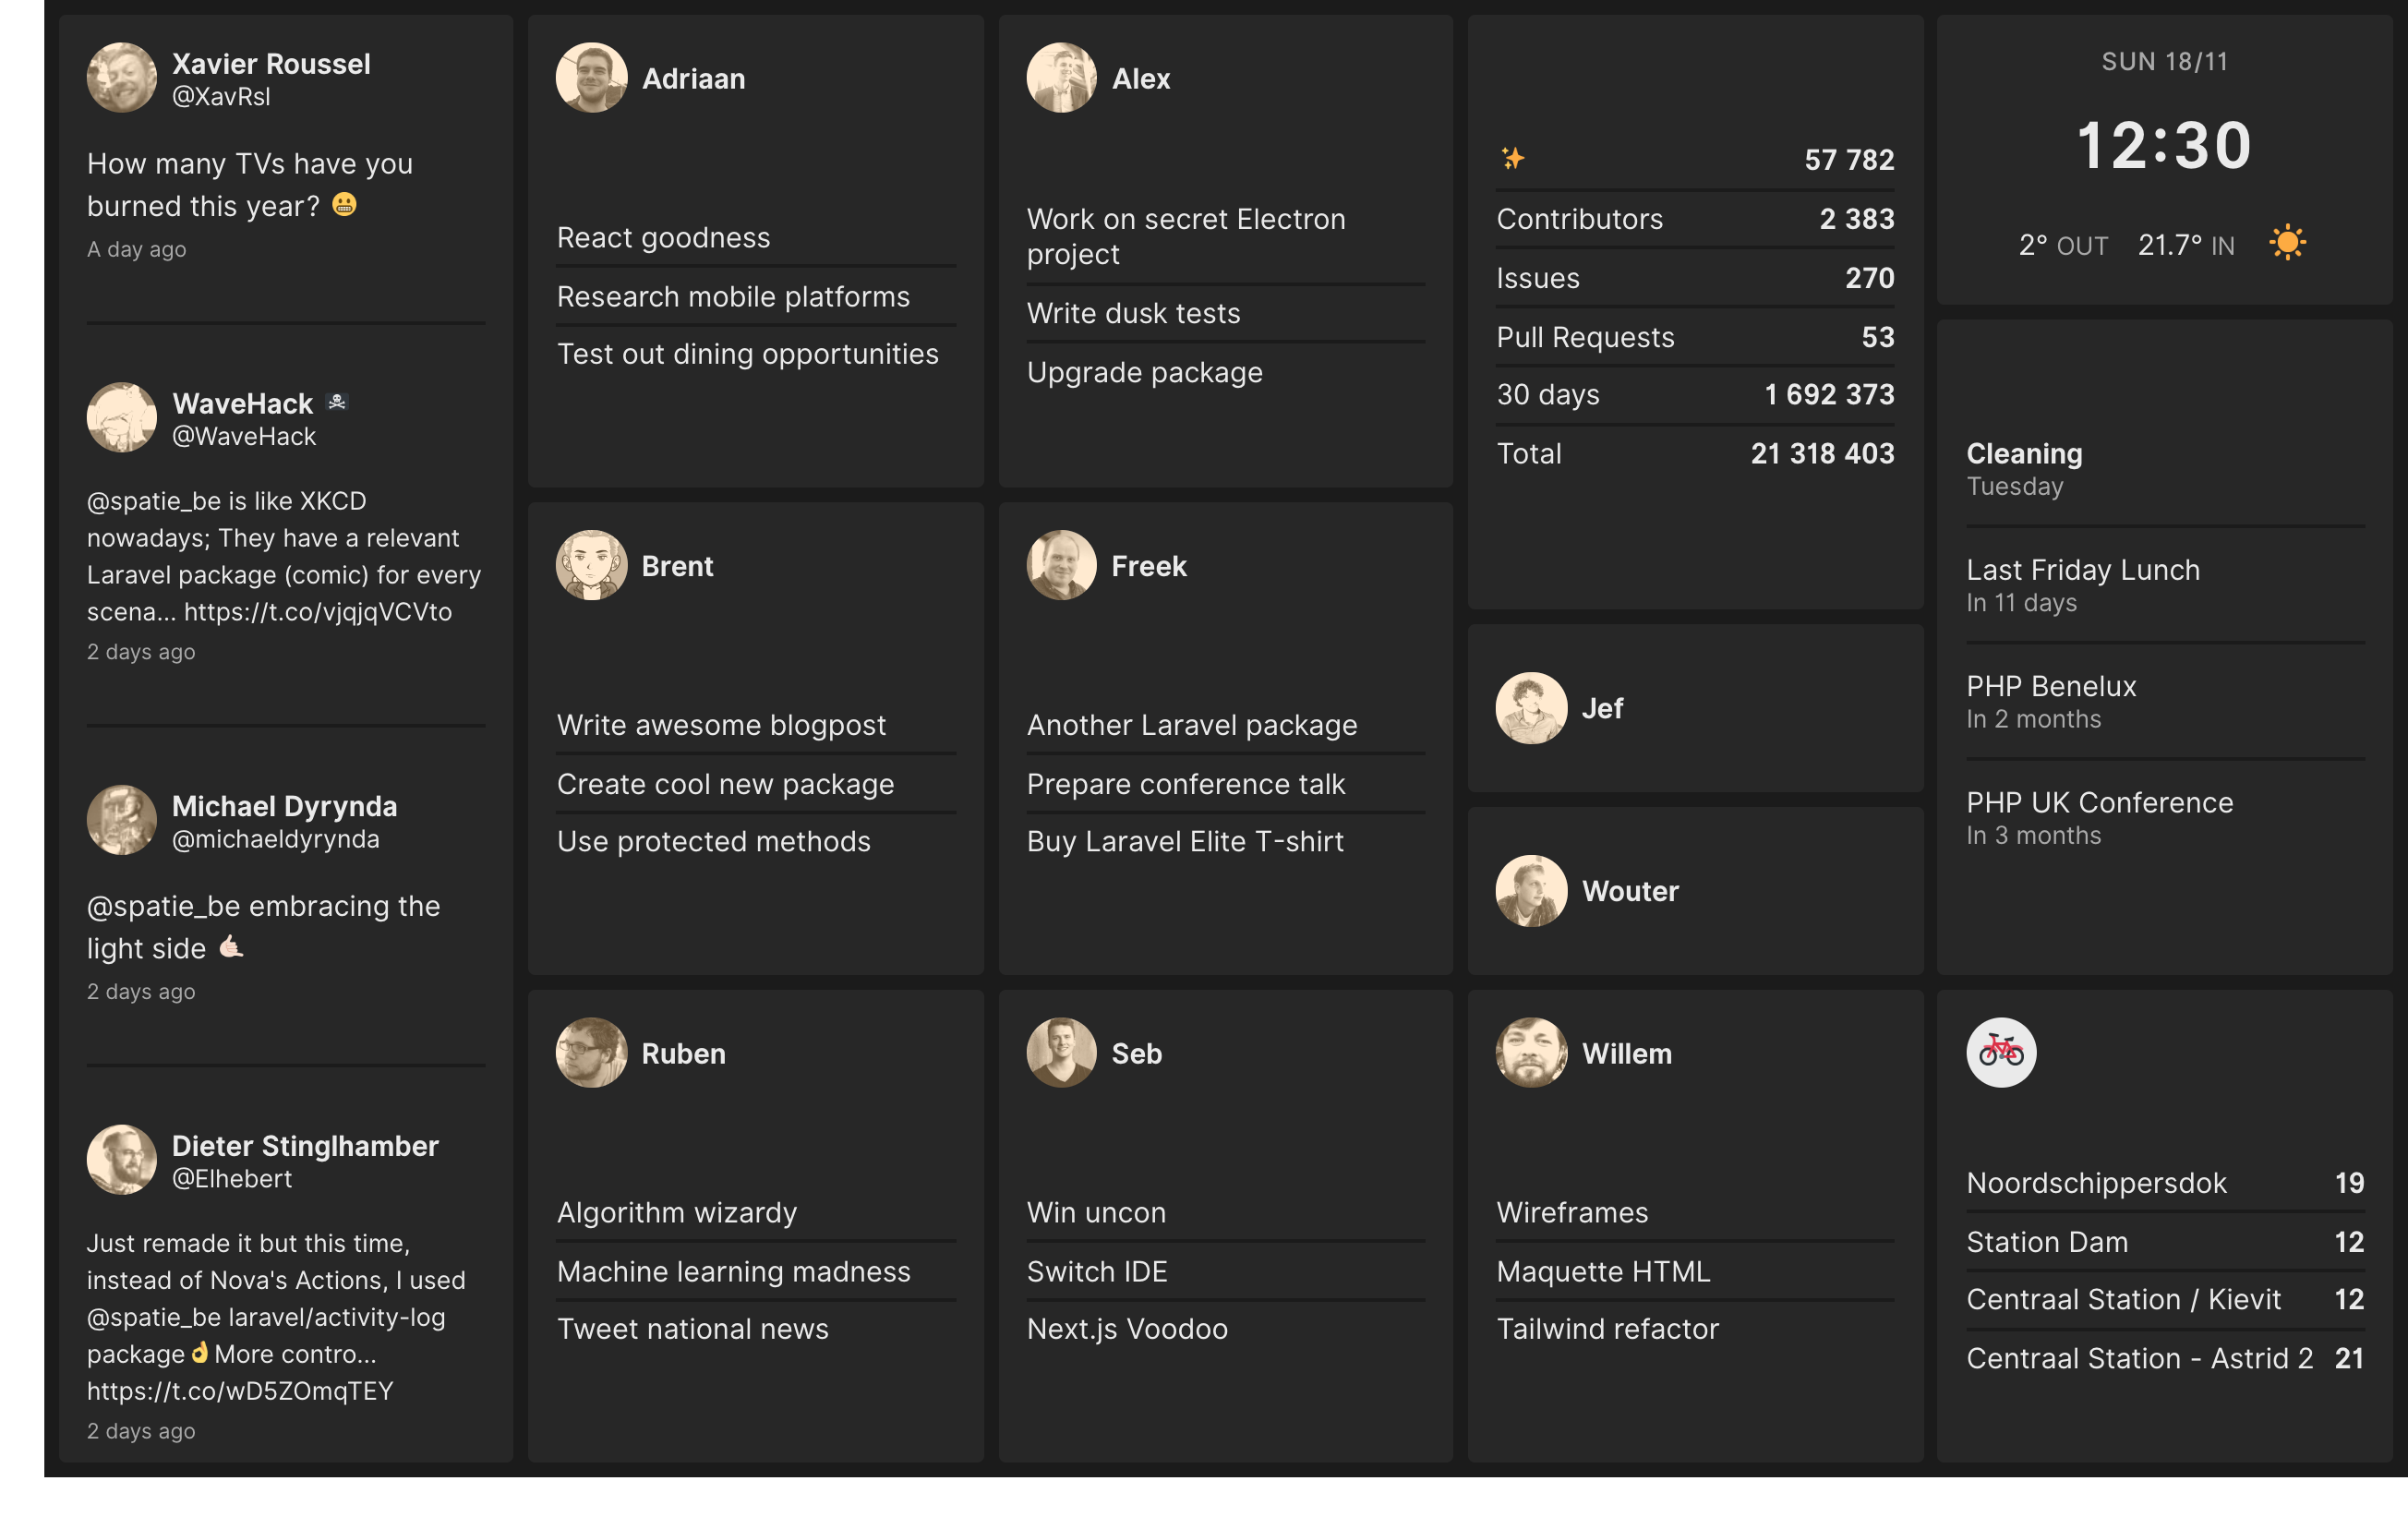
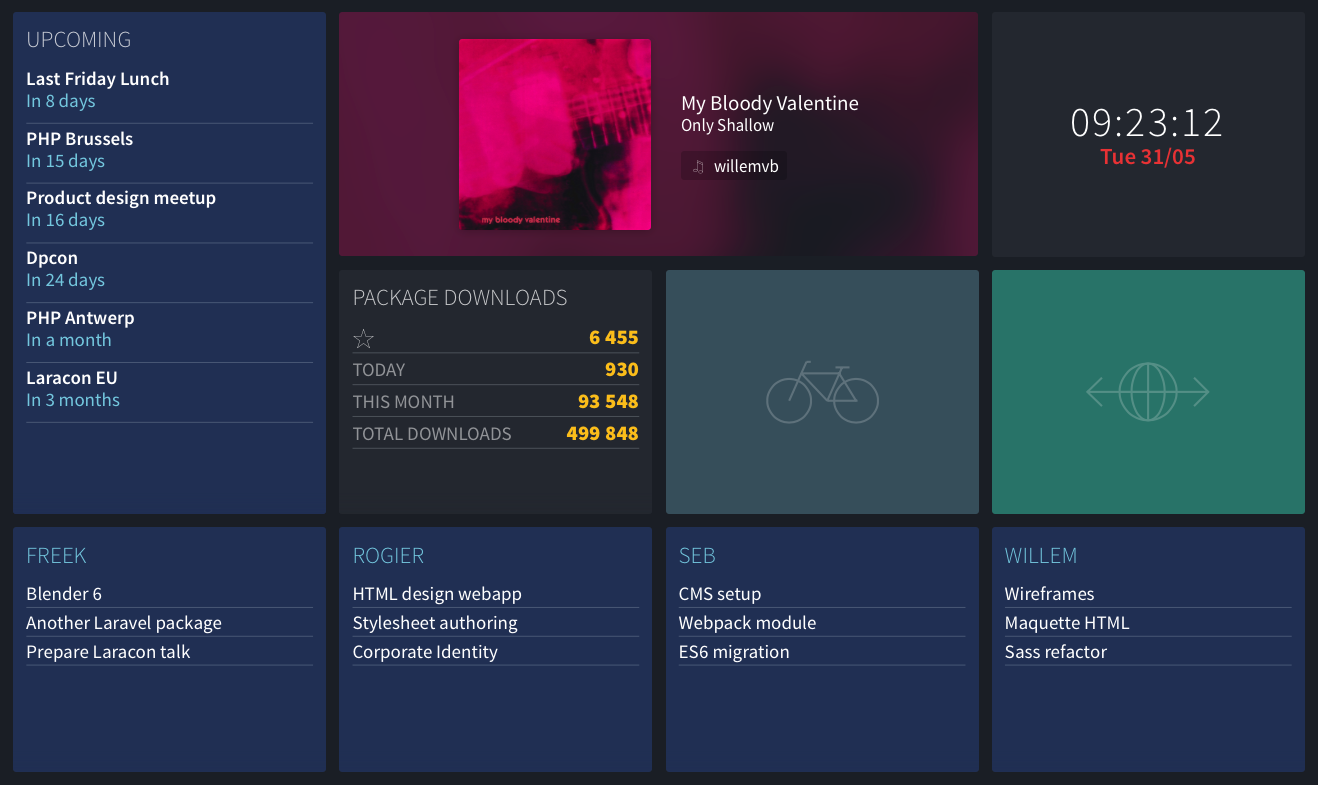
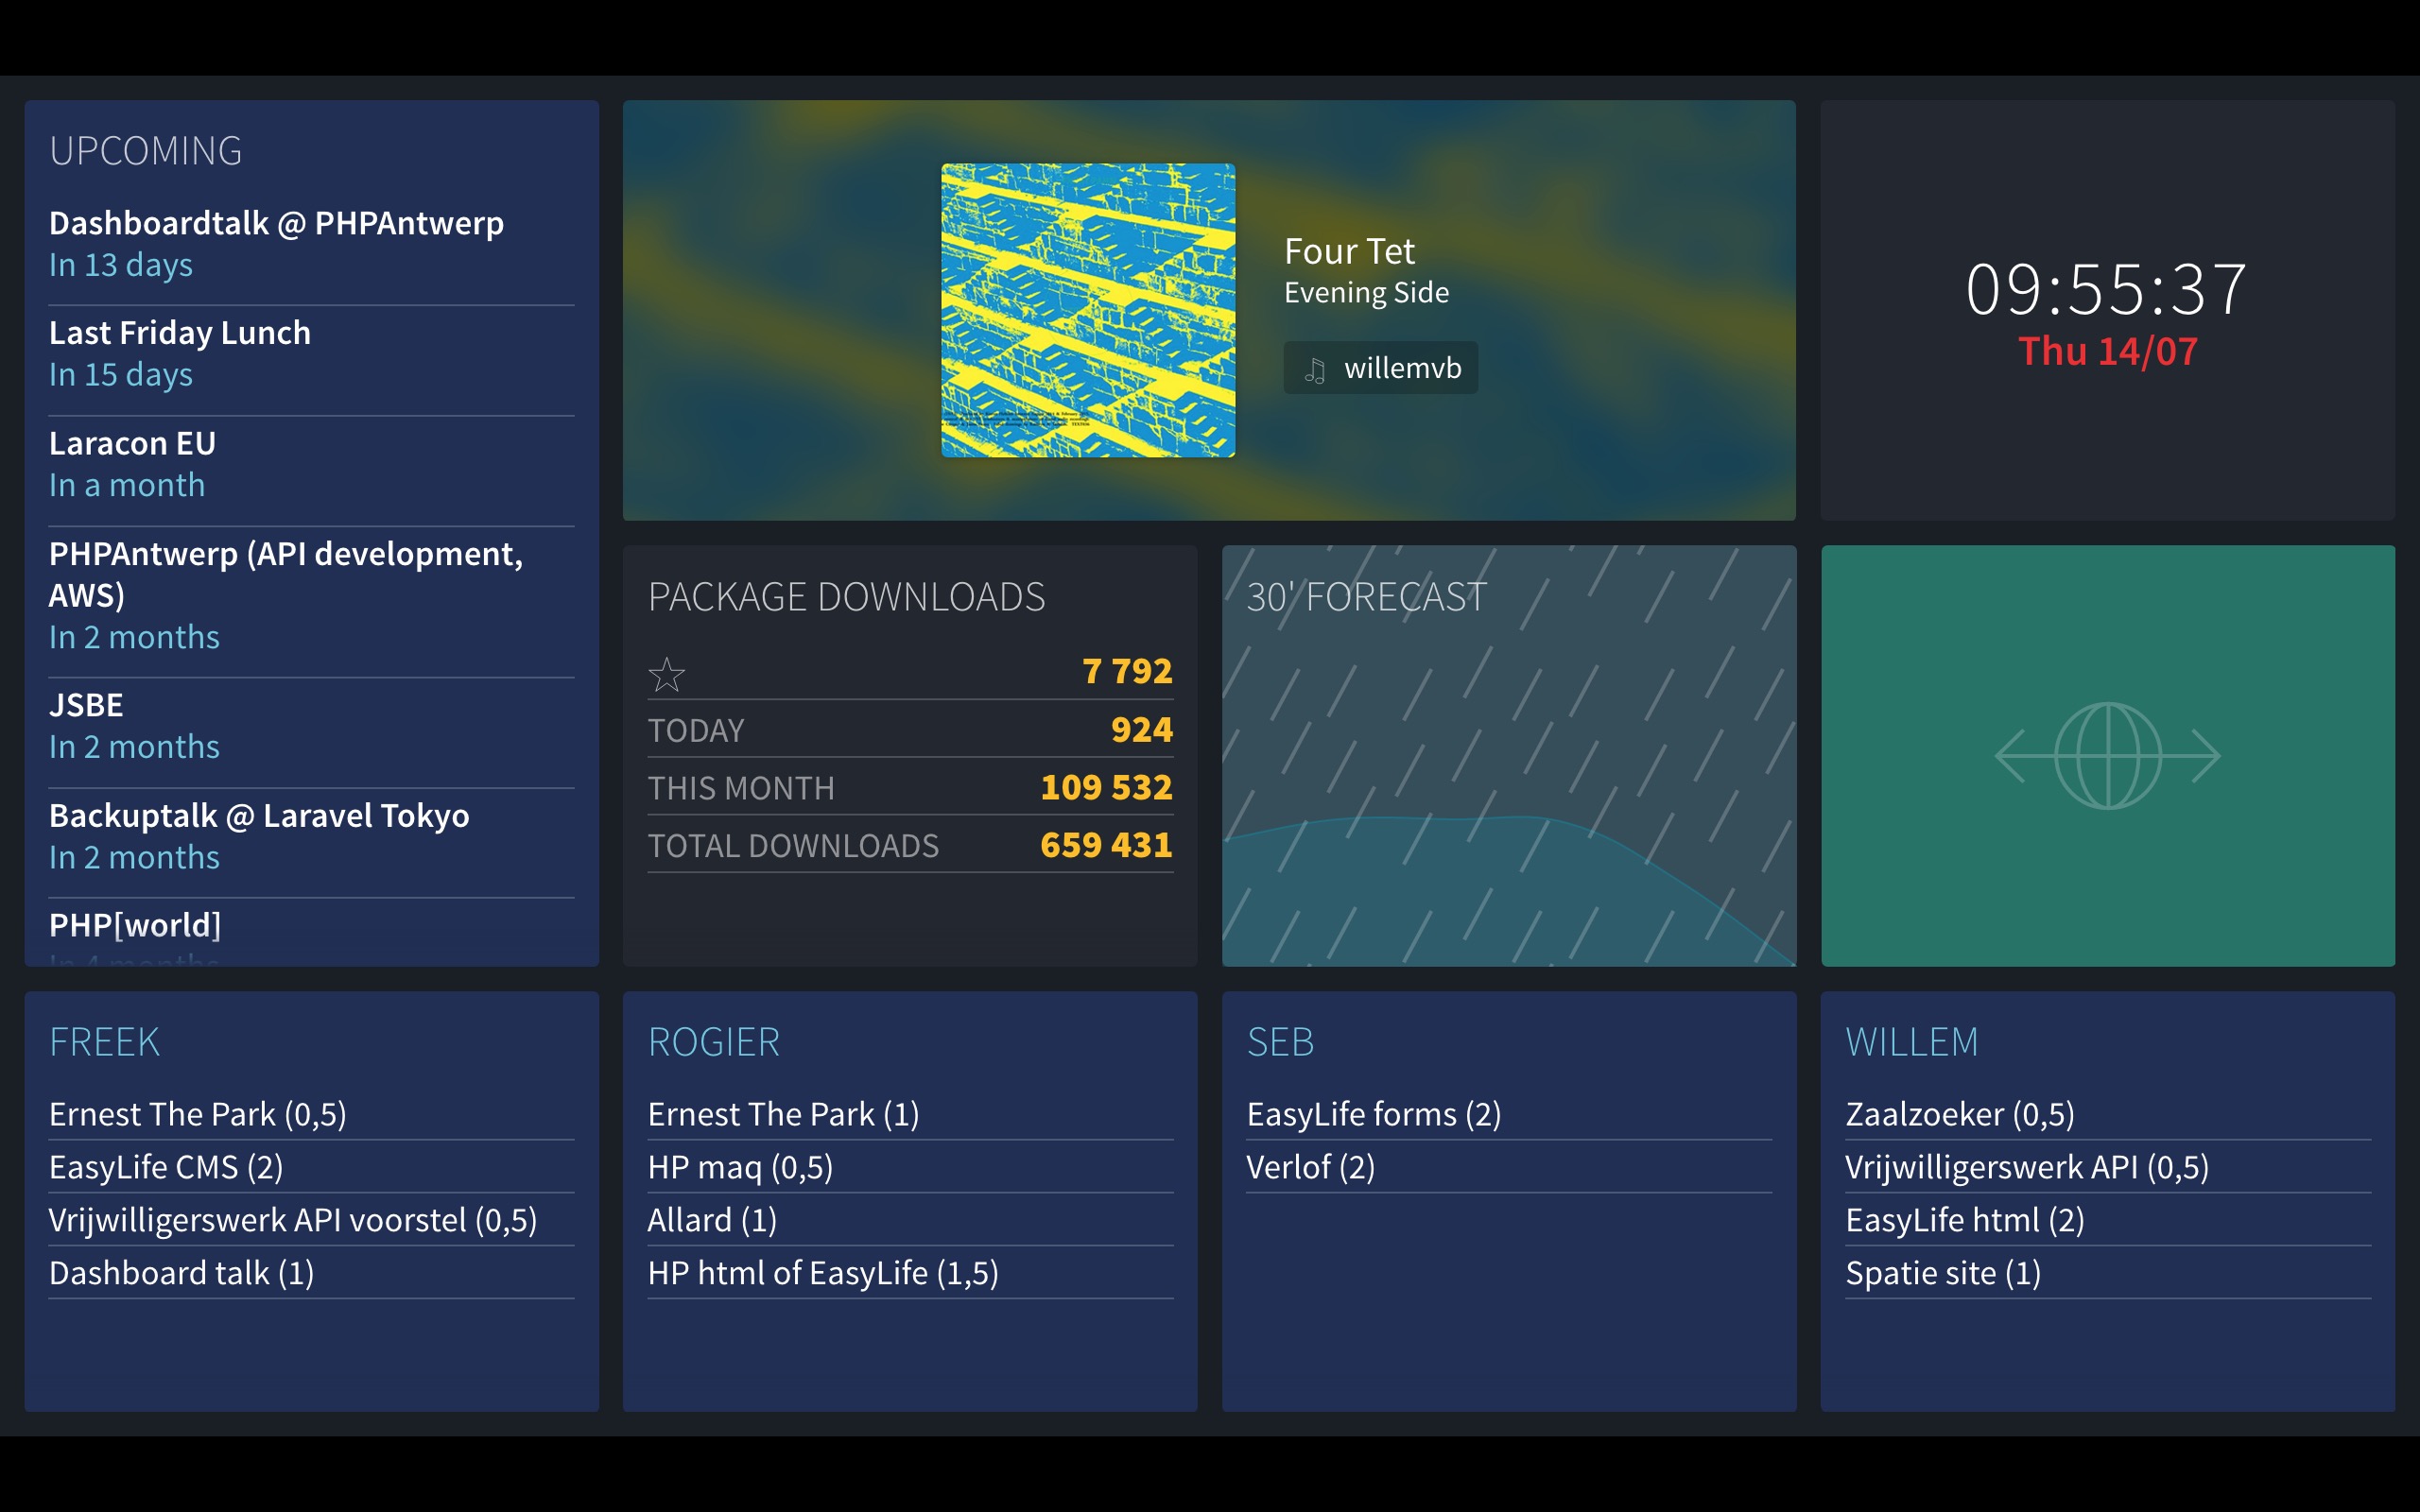
At Spatie we have a tv screen against the wall that displays a dashboard. This dashboard displays the tasks our team should be working on, important events in the near future, which tasks each of our team members should be working on, what music they are listening to, and so on. Here's what it looks like:
We've open sourced our dashboard so you can view the entire source code on GitHub. It is built with Laravel 5.7, Vue and Tailwind CSS.
This dashboard is not entirely new. The initial version was published a couple of years ago. At our company, we like to tinker with new stuff. That's why we perform a big cleanup of the source code every year. We also update all the dependencies and technologies used. This year we focused on updating the design. The dashboard now uses Tailwind CSS. In this blog post, which is an update to the previous one, I like to explain how this dashboard is built.
You'll need to be familiar with both Laravel and Vue to get the most out of this post. If you need to brush up your Vue knowledge, I can highly recommend Laracasts lessons on Vue.
History
We've had a dashboard at Spatie for quite some time now. Before our current Laravel-based one we used Dashing, a framework to quickly build dashboards. The framework was created by the folks at Shopify and uses Ruby under the hood.
When I first built our dashboard, a few years ago, we were at a crossroads with our company. There wasn't much momentum in the PHP world and we were toying with the idea of switching over to Ruby. The idea was that by playing with Dashing we would get some experience with the language. Then Composer and Laravel happened and we decided to stick with PHP (and given the current state of PHP ecosystem we don't regret that choice at all).
When support for Dashing had officially stopped, I thought it was a good time to completely rebuild the dashboard using Laravel and Vue.
The tiles
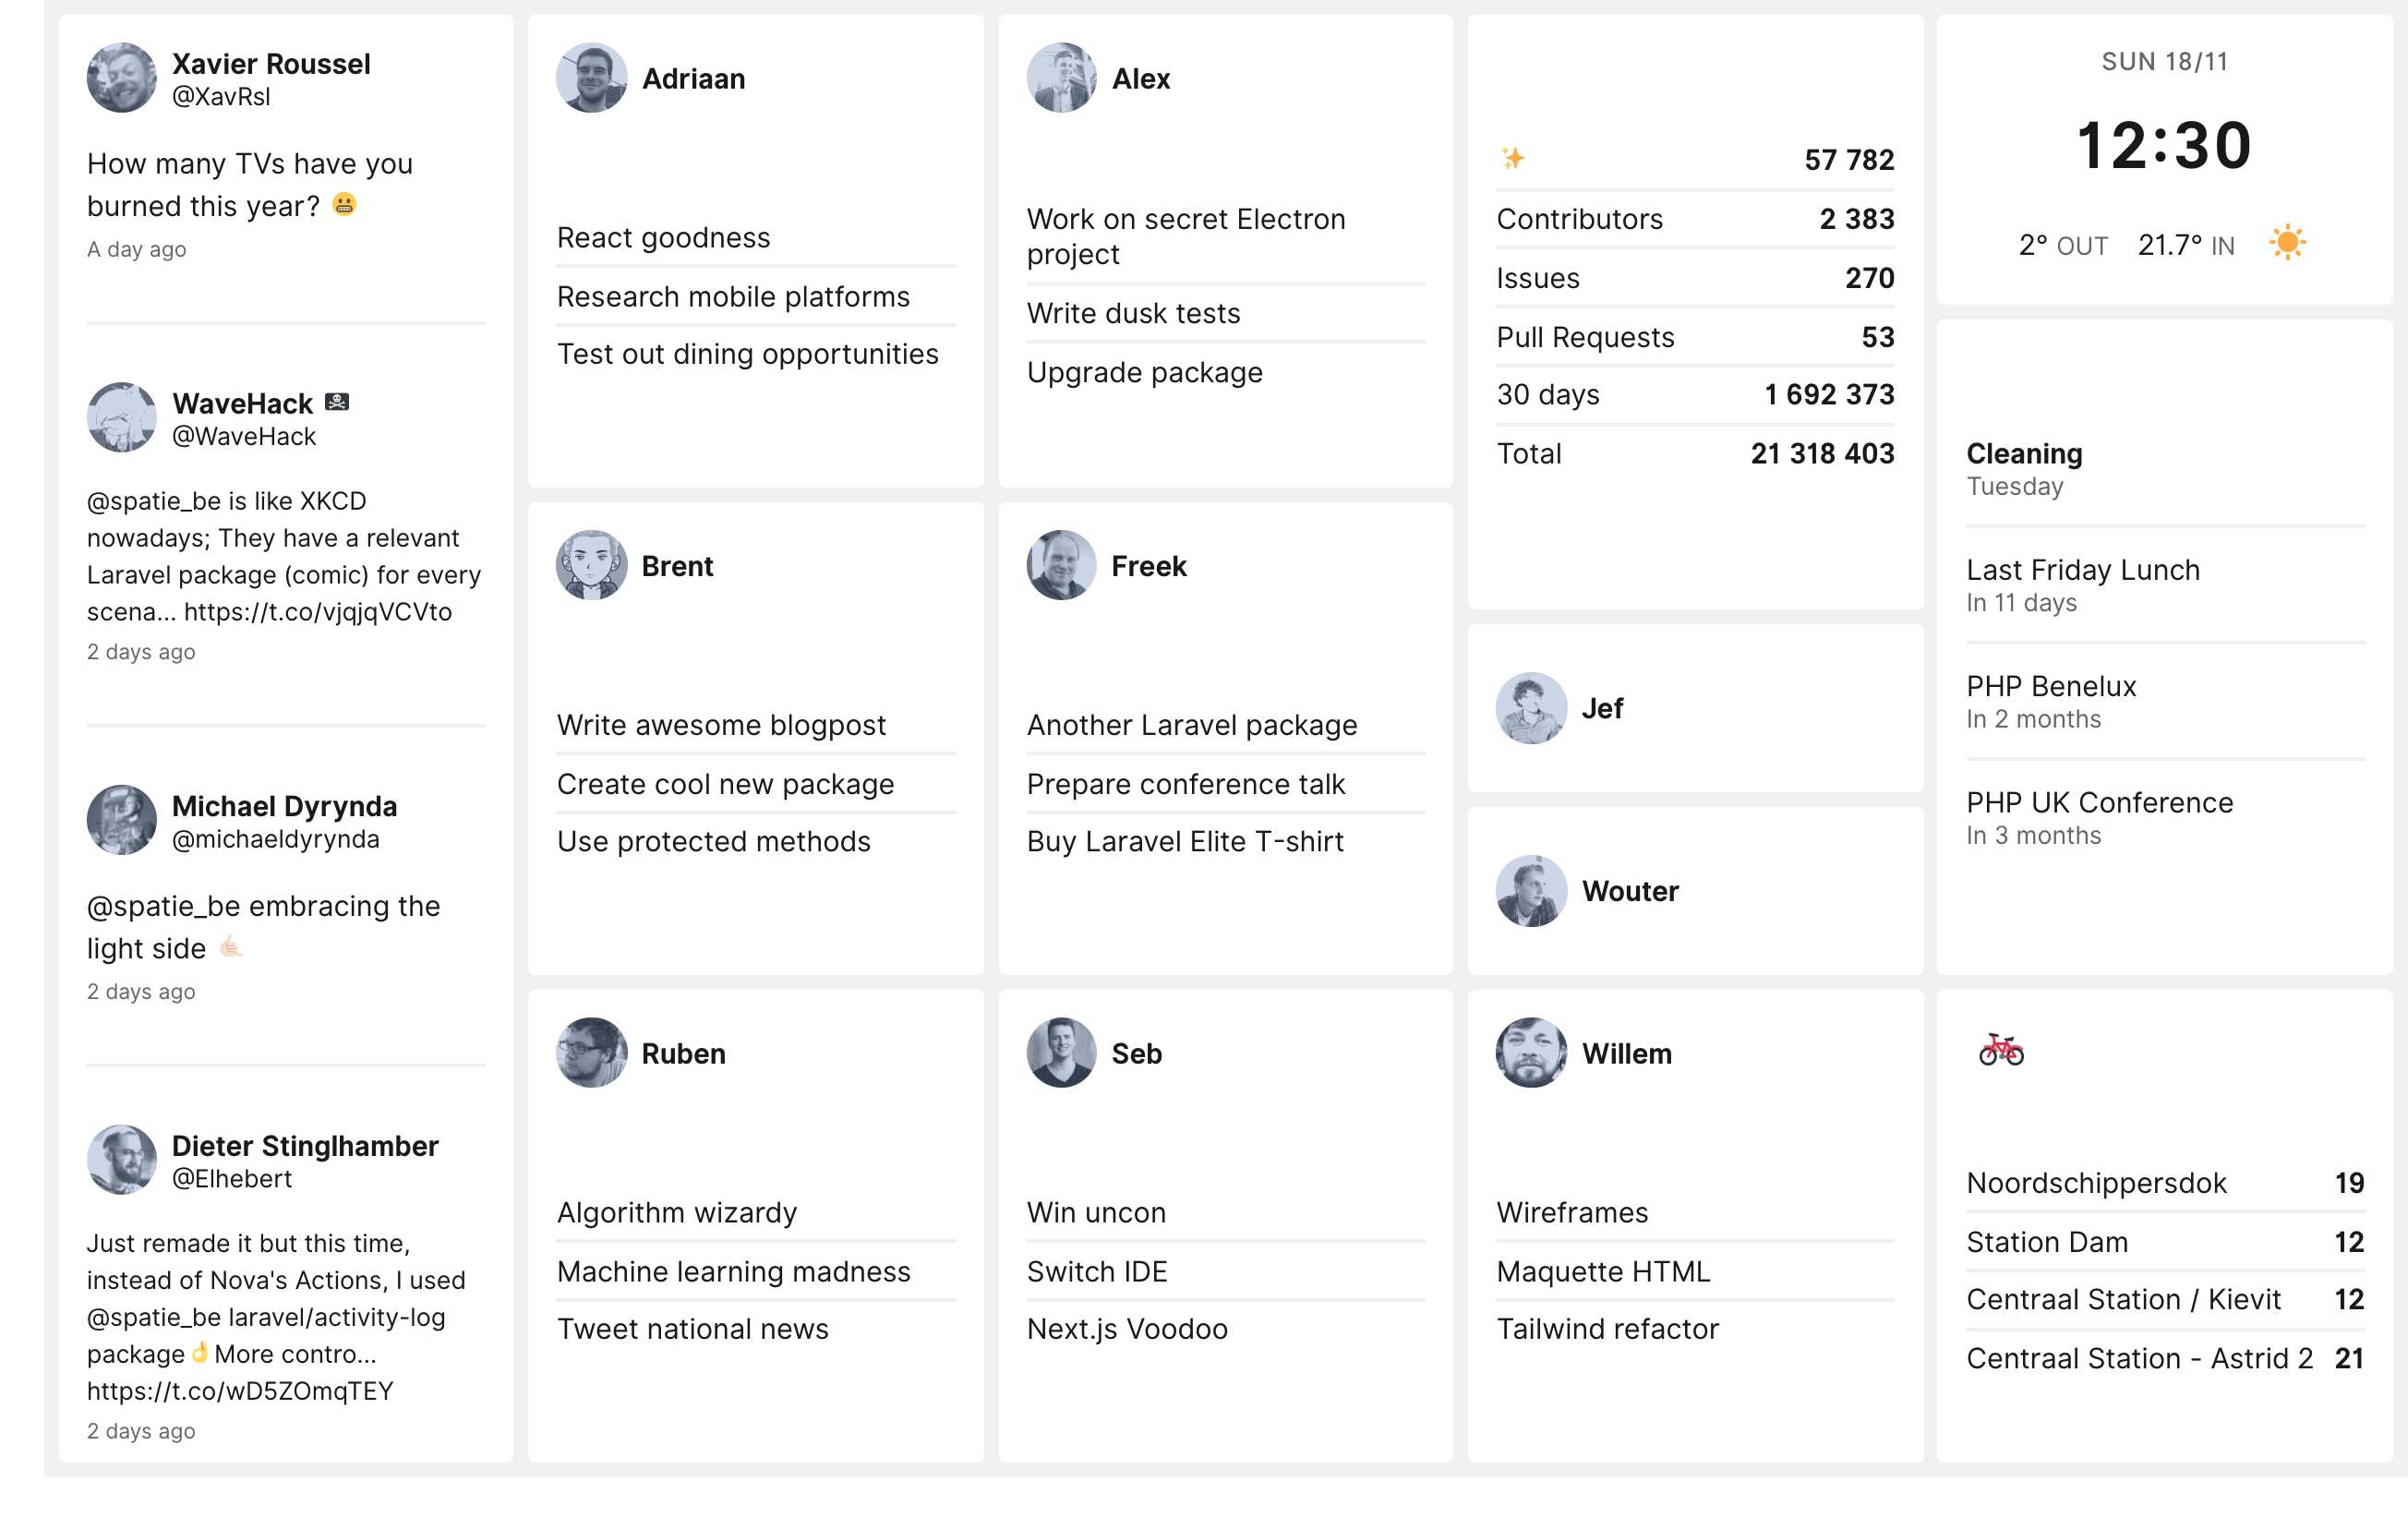
Let's take a closer look at what the dashboard is displaying. The configured dashboard from the above screenshot has the following tiles:
- A Twitter tile that shows all mentions of quotes of
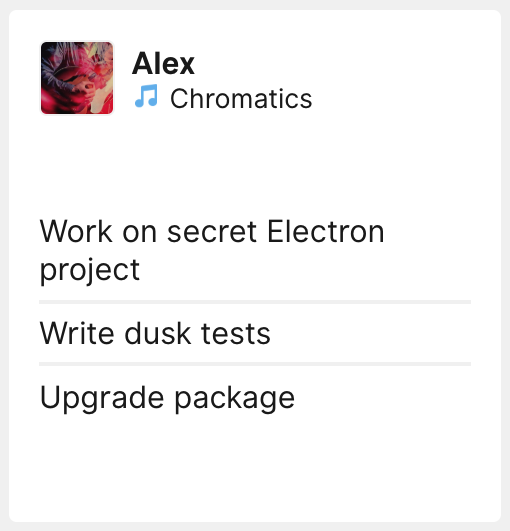
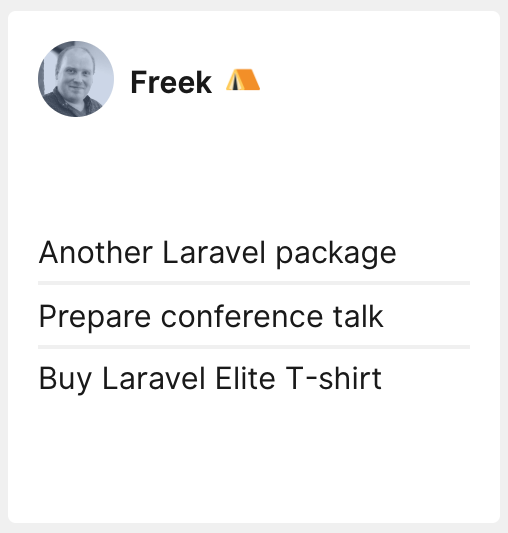
@spatie_be - There's a dedicated tile for each member of our team. Each tile displays the tasks for that member for the current week. Those tasks are fetched from a few markdown files in a private repo on GitHub. There's a little bit more to this tile. More on that later.
- Some statistics of our numerous public repositories on GitHub. This data is coming from the GitHub and the Packagist API
- A team calendar that pulls in events from a Google Calendar.
- A clock with the current date. and some weather conditions, retrieve from the Yahoo Weather API. We also display the temperature inside our office. That data is fetched from a temperature sensor (a big thank you to Alex for adding this)
- In our home city, Antwerp, there is a shared biking system called Vélo. The bike tile shows how many bikes there are available in the nearest bike points near our office.
To help everyone to stay "in the zone" we bought the entire team Bose QuietComfort headphones. The dashboard displays the current track for each team member on his team member tile. The avatar will be replaced by the artwork of the album. We leverage the API of last.fm to get this info.
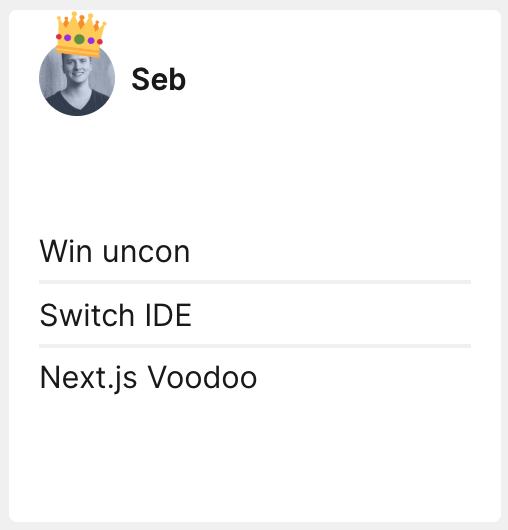
The team member tile will also display a little crown when it's someone's birthday?
Team members regularly work from home. When not working in the office for a day we have the habit of setting our status in Slack to "Working from home". When a team member sets that status in Slack we'll display a nice little tent emoji.
High-level overview
After the browser displays the dashboard for the first time we'll never refresh the page again. WebSockets and Vue are being used to update the tiles. Doing it this way will avoid having to refresh the page and in turn, avoid flashing screens.
Each tile is it's own Vue component. Laravel's default scheduler is used to periodically fetch some data from the APIs of Google Calendar, Last.fm, etc... When Laravel receives a response from any of those services a broadcast event is fired to Pusher. This powerful service leverages webSockets to carry over server events to clients in realtime. On the client side we'll use Laravel Echo. That JavaScript library makes handling those Pusher events very easy. Still on the client side each Vue component will listen for incoming events to update the displayed tiles.
The grid
Before diving into the Laravel and Vue code I'd like to explain how the grid system works. The grid system allows you to easily specify where a tile should be positioned on the dashboard and how big it should be.
This is the HTML of the actual blade view that renders the dashboard page.
<dashboard class="font-sans">
    <twitter :initial-tweets="{{ json_encode($initialTweets) }}" position="a1:a12"></twitter>
    <uptime position="a1:a12"></uptime>
    <team-member name="adriaan" avatar="{{ gravatar('adriaan@spatie.be') }}" birthday="1995-10-22" position="b1:b4"></team-member>
    <team-member name="alex" avatar="{{ gravatar('alex@spatie.be') }}" birthday="1996-02-05" position="c1:c4"></team-member>
    <team-member name="brent" avatar="{{ gravatar('brent@spatie.be') }}" birthday="1994-07-30" position="b5:b8"></team-member>
    <team-member name="freek" avatar="{{ gravatar('freek@spatie.be') }}" birthday="1979-09-22" position="c5:c8"></team-member>
    <team-member name="ruben" avatar="{{ gravatar('ruben@spatie.be') }}" birthday="1994-05-16" position="b9:b12"></team-member>
    <team-member name="seb" avatar="{{ gravatar('sebastian@spatie.be') }}" birthday="1992-02-01" position="c9:c12"></team-member>
    <team-member name="willem" avatar="{{ gravatar('willem@spatie.be') }}" birthday="1975-09-04" position="d9:d12"></team-member>
    <team-member name="jef" avatar="{{ gravatar('jef@spatie.be') }}" birthday="1975-03-28" position="d7"></team-member>
    <team-member name="wouter" avatar="{{ gravatar('wouter@spatie.be') }}" birthday="1991-03-15" position="d8"></team-member>
    <statistics position="d1:d6"></statistics>
    <time-weather position="e1:e3" date-format="ddd DD/MM" time-zone="Europe/Brussels" weather-city="Antwerp"></time-weather>
    <calendar position="e4:e9"></calendar>
    <velo position="e10:e12"></velo>
    <internet-connection position="e1:e3"></internet-connection>
</dashboard>
Grid columns are named with a letter and rows are named with a number, like a spreadsheet. The size and positioning of a tile are determined in a position property per component that accepts a column name and a row number. a1 will render the component on the first row in the first column. If you look at the first team-member component you see b1:b4, so as you see in the screenshot of the dashboard, this component will get displayed in the second column starting from the first row and it is 4 positions long.
Our dashboard uses 5 columns and 12 rows. Want to change the size of your dashboard? No problem: just keep adding tiles. The number of rows and columns needed is automatically inferred.
Most modern tv's use a 16:9 ratio, but we've gone the extra mile to make the layout fully responsive so it still works on tv's and monitors with a different ratio.
My colleague Willem designed the looks and did all the Tailwind work. He sure did an awesome job in making it look very pretty.
The internet connection component
Let's take a deeper look at a component to grasp the general flow. A simple one is the internet-connection tile which notifies us when the internet connection is down.
By default, it is not shown. When there's no internet connection a small notice will be displayed in the top right corner. Here's how that looks:
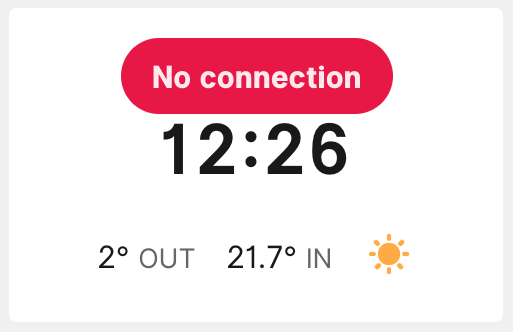
It works by listening to an event, called Heartbeat, that is sent out every minute by the server. When it doesn't get an event within a couple of minutes it'll determine that our internet connection is down (although it could also mean that the server where the dashboard is running on is having problems).
Server side
In the Laravel app, you'll see a directory app/Events that holds all events. It contains subdirectories for each component of the dashboard. All events that are sent from the server to the client reside there. In the app/Events directory, you'll also see a file named DashboardEvent which is used to transfer data from the server to the client through events.
namespace App\Events;

use Illuminate\Broadcasting\PrivateChannel;
use Illuminate\Contracts\Broadcasting\ShouldBroadcast;

abstract class DashboardEvent implements ShouldBroadcast
{
    public function broadcastOn()
    {
        return new PrivateChannel('dashboard');
    }
}
That ShouldBroadcast interface is provided by Laravel. All events will get broadcasted on the private channel named dashboard. The client will listen to all events on that channel. Using the PrivateChannel class will ensure that all data will be sent in a secure way so nobody can listen in. More on that later.
Let's take a look in the app/Console/Components directory. Almost all logic that the server needs to do to fetch data for the dashboard has a home here. If you open up that directory you'll see that each component has its own subdirectory. In each subdirectory, you'll find an Artisan command that can be scheduled. In our example the App\Console\Components\SendHeartbeatCommand class contains this code:
namespace App\Console\Components\Dashboard;

use Illuminate\Console\Command;
use App\Events\Dashboard\Heartbeat;

class SendHeartbeatCommand extends Command
{
    protected $signature = 'dashboard:send-heartbeat';

    protected $description = 'Send a heartbeat to the internet connection tile';

    public function handle()
    {
        $this->info('Sending heartbeat...');

        event(new Heartbeat());

        $this->info('All done!');
    }
}
The only thing that this code does is send out a HeartBeat-event. This command is scheduled to run every minute in the Console kernel.
Client side
All JavaScript code used by the dashboard lives in the resources/assets/js directory. In resources/assets/js/app.js you see that the main Vue instance is being initialized on the body element:
new Vue({
    el: '#dashboard',

    components: {
        Dashboard,
        Calendar,
        Statistics,
        InternetConnection,
        TeamMember,
        TimeWeather,
        Twitter,
        Uptime,
        Velo,
    },

    created() {
        this.echo = new Echo({
            broadcaster: 'pusher',
            key: window.dashboard.pusherKey,
            cluster: window.dashboard.pusherCluster,
        });
    },
});
The components themselves live in the resources/assets/js/components directory. This is the code of the InternetConnection.vue inside that directory:
<template>
    <tile :position="position" class="z-10" style="--bg-tile: transparent">
        <div v-if="offline" class="flex">
            <div class="px-4 py-2 mx-auto font-black text-invers bg-error rounded-full shadow-lg">
                No connection
            </div>
        </div>
    </tile>
</template>
<script>
import echo from '../mixins/echo';
import moment from 'moment';
import Tile from './atoms/Tile';

export default {
    components: {
        Tile,
    },

    mixins: [echo],

    props: ['position'],

    data() {
        return {
            offline: false,
            lastHeartBeatReceivedAt: moment(),
        };
    },

    created() {
        setInterval(this.determineConnectionStatus, 1000);
    },

    methods: {
        determineConnectionStatus() {
            const lastHeartBeatReceivedSecondsAgo = moment().diff(
                this.lastHeartBeatReceivedAt,
                'seconds'
            );

            this.offline = lastHeartBeatReceivedSecondsAgo > 125;
        },

        getEventHandlers() {
            return {
                'Dashboard.Heartbeat': () => {
                    this.lastHeartBeatReceivedAt = moment();
                },
            };
        },
    },
};
</script>
There's a whole lot going on in that code. Let's break it down. Everything between the <template>-tags is the HTML code that actually gets rendered. That v-if directive makes sure that the section is only rendered when the state variable offline is true. Again, if you're having trouble following this, check the series on Vue on Laracasts.
In the created method, which is fired as soon as the Vue component is created, we'll make sure that a method on the Vue instance called determineConnectionStatus is fired every second. That function is responsible for determining the value of online. If the last received heartbeat is less than 125 seconds ago, online will be true, otherwise, it will be false.
Let's review how we can listen for events. In the code above you'll see a method called getEventHandlers. It expects an object of which the property names are the events names. The event name is the fully qualified class name of the event that gets sent out by the server (App\Events\InternetConnection\Heartbeat) but without App\Events and with the \ replaced by a .. So in our example that would become InternetConnection.Heartbeat. The value of a property on that object should be a function that will get executed whenever that event comes in from the server.
Whenever the InternetConnectionStatus.Heartbeat.HeartBeat event comes in we're going to set the state of lastHeartBeatReceivedAt to the current time. So if this event comes in the determineConnectionStatus function will determine that we're online for the next 125 seconds.
Did you notice that the component uses an Echo mixin? A mixin can be compared to a trait in the PHP-world. A mixin contains some functions. Every component that uses the mixin will get those functions. So, like a trait, a mixin is a way to bundle reusable code.
The Echo mixin is responsible for adding the power of Laravel Echo to the component. Laravel Echo is a JavaScript library that makes it easy to handle webSockets. It will handle all authentication and communication with Pusher. Echo is being set up in app.js
Laravel Echo can handle multiple broadcasters, we're going to use Pusher here. That key is a public value that's needed to communicate with Pusher.
Let's go back take a look at the code of the Echo mixin.
import { forIn } from 'lodash';

export default {
    created() {
        forIn(this.getEventHandlers(), (handler, eventName) => {
            this.$root.echo
                .private('dashboard')
                .listen(`.App.Events.${eventName}`, response => handler(response));
        });
    },
};
Whenever a component that uses the mixin is created the created function will be executed. It will process the output of getEventHandlers function from the component itself. First, we'll build up the fully qualified event name. Then we'll let Echo listen for events with that name on the private dashboard channel. Whenever an event with the right name comes in we're going to pass the response to the handler and execute it.
The statistics component
Let's take a look at another component. In the screenshot of the dashboard, you can see that there are some statistics displayed regarding how many times our packages get downloaded.
The FetchPackagistTotalsCommand class, located in app/Console/Components/Statistics/FetchPackagistTotalsCommand is responsible for fetching the package statistics via the Packagist API, and transforming it to an array. After that, it'll fire off an event to inform the Vue side of things that new data is available.
namespace App\Console\Components\Statistics;

use GuzzleHttp\Client;
use Illuminate\Console\Command;
use Spatie\Packagist\Packagist;
use App\Events\Statistics\PackagistTotalsFetched;

class FetchPackagistTotalsCommand extends Command
{
    protected $signature = 'dashboard:fetch-packagist-totals';

    protected $description = 'Fetch totals for all our PHP packages';

    public function handle()
    {
        $this->info('Fetching packagist totals...');

        $packagist = new Packagist(new Client());

        $totals = collect($packagist->getPackagesByVendor(config('services.packagist.vendor'))['packageNames'])
                ->map(function ($packageName) use ($packagist) {
                    return $packagist->findPackageByName($packageName)['package'];
                })
                ->pipe(function ($packageProperties) {
                    return [
                        'monthly' => $packageProperties->sum('downloads.monthly'),
                        'total' => $packageProperties->sum('downloads.total'),
                    ];
                });
        event(new PackagistTotalsFetched($totals));

        $this->info('All done!');
    }
}
Most of this code should be self-explanatory. It's also scheduled to run periodically. Let's take a look at the PackagistTotalsFetched event that's being sent out:
namespace App\Events\Statistics;

use App\Events\DashboardEvent;

class PackagistTotalsFetched extends DashboardEvent
{
    /** @var int */
    public $monthly;

    /** @var int */
    public $total;

    public function __construct(array $totals)
    {
        $this->monthly = $totals['monthly'];

        $this->total = $totals['total'];
    }
}
When broadcasting events in Laravel, all public properties of an event are being broadcasted as well. So using this code the Vue component can easily get to the values of $monthly and $total.
Here's the Vue Component that renders the tile on the dashboard:
<template>
    <tile :position="position">
        <div class="grid gap-padding h-full markup">
            <ul class="align-self-center">
                <li>
                    <span v-html="emoji('✨')" />
                    <span class="font-bold">{{ formatNumber(githubStars) }}</span>
                </li>
                <li>
                    <span>Contributors</span>
                    <span class="font-bold">{{ formatNumber(githubContributors) }}</span>
                </li>
                <li>
                    <span>Issues</span>
                    <span class="font-bold">{{ formatNumber(githubIssues) }}</span>
                </li>
                <li>
                    <span>Pull Requests</span>
                    <span class="font-bold">{{ formatNumber(githubPullRequests) }}</span>
                </li>
                <li>
                    <span>30 days</span>
                    <span class="font-bold">{{ formatNumber(packagistMonthly) }}</span>
                </li>
                <li>
                    <span>Total</span>
                    <span class="font-bold">{{ formatNumber(packagistTotal) }}</span>
                </li>
            </ul>
        </div>
    </tile>
</template>
<script>
import { emoji, formatNumber } from '../helpers';
import echo from '../mixins/echo';
import Tile from './atoms/Tile';
import saveState from 'vue-save-state';

export default {
    components: {
        Tile,
    },

    mixins: [echo, saveState],

    props: ['position'],

    data() {
        return {
            githubStars: 0,
            githubIssues: 0,
            githubPullRequests: 0,
            githubContributors: 0,

            packagistTotal: 0,
            packagistMonthly: 0,
        };
    },

    methods: {
        emoji,
        formatNumber,

        getEventHandlers() {
            return {
                'Statistics.GitHubTotalsFetched': response => {
                    this.githubStars = response.stars;
                    this.githubIssues = response.issues;
                    this.githubPullRequests = response.pullRequests;
                    this.githubContributors = response.contributors;
                },

                'Statistics.PackagistTotalsFetched': response => {
                    this.packagistTotal = response.total;
                    this.packagistMonthly = response.monthly;
                },
            };
        },

        getSaveStateConfig() {
            return {
                cacheKey: 'statistics',
            };
        },
    },
};
</script>
Notice that in the getEventHandlers function we'll update the state variables packagistTotal and packagistMonthly to the values that we get from the PackagistTotalsFetched-event.
Dark mode
A new feature that we added to our dashboard this year is dark mode. When the sun is down, dark mode will be activated. This is how the dashboard will look when it's dark outside.
 .
.
To determine when the sun is up or down there's no need to call an external webservice. PHP has some obscure built-in functions to determine the sunrise and sunset.
Here's the content of DetermineAppearanceCommand, which is scheduled to fire off every minute.
namespace App\Console\Components\Dashboard;

use Carbon\Carbon;
use Illuminate\Console\Command;
use App\Events\Dashboard\UpdateAppearance;

class DetermineAppearanceCommand extends Command
{
    protected $signature = 'dashboard:determine-appearance';

    protected $description = 'Determine the looks of the dashboard';

    /** @var float */
    protected $antwerpLat = 51.260197;

    /** @var float */
    protected $antwerpLng = 4.402771;

    public function handle()
    {
        $this->info('Determining dashboard appearance...');

        $appearance = $this->sunIsUp()
            ? 'light-mode'
            : 'dark-mode';

        event(new UpdateAppearance($appearance));

        $this->info('All done!');
    }

    public function sunIsUp(): bool
    {
        $sunriseTimestamp = date_sunrise(
            now()->timestamp,
            SUNFUNCS_RET_TIMESTAMP,
            $this->antwerpLat,
            $this->antwerpLng
        );
        $sunrise = Carbon::createFromTimestamp($sunriseTimestamp);

        $sunsetTimestamp = date_sunset(
            now()->timestamp,
            SUNFUNCS_RET_TIMESTAMP,
            $this->antwerpLat,
            $this->antwerpLng
        );
        $sunset = Carbon::createFromTimestamp($sunsetTimestamp);

        return now()->between($sunrise, $sunset);
    }
}
Executing the command will fire off an event called UpdateAppearance. That event will be initialized with either light-mode or dark-mode.
Clientside we have a Dashboard component that listens for that event. It sets either light-mode or dark-mode as a css class on the Dashboard.
<template>
    <div
        class="fixed pin grid gap-spacing w-screen h-screen p-spacing font-normal leading-normal text-default bg-screen"
        :class="mode"
    >
        <slot></slot>
    </div>
</template>
<script>
import echo from '../mixins/echo';
import saveState from 'vue-save-state';

export default {
    mixins: [echo, saveState],

    data() {
        return {
            mode: 'light-mode',
        };
    },

    methods: {
        getEventHandlers() {
            return {
                'Dashboard.UpdateAppearance': response => {
                    this.mode = response.mode;
                },
            };
        },

        getSaveStateConfig() {
            return {
                cacheKey: `dashboard`,
            };
        },
    },
};
</script>
In our css we change a few variables when that dark-mode class is applied.
.dark-mode {
    --text-default: var(--text-default-dark);
    --text-dimmed: var(--text-dimmed-dark);
    --text-invers: var(--text-invers-dark);
    --text-accent: var(--text-accent-dark);

    --bg-screen: var(--bg-screen-dark);
    --bg-tile: var(--bg-tile-dark);
    --bg-warn: var(--bg-warn-dark);
    --bg-error: var(--bg-error-dark);
}
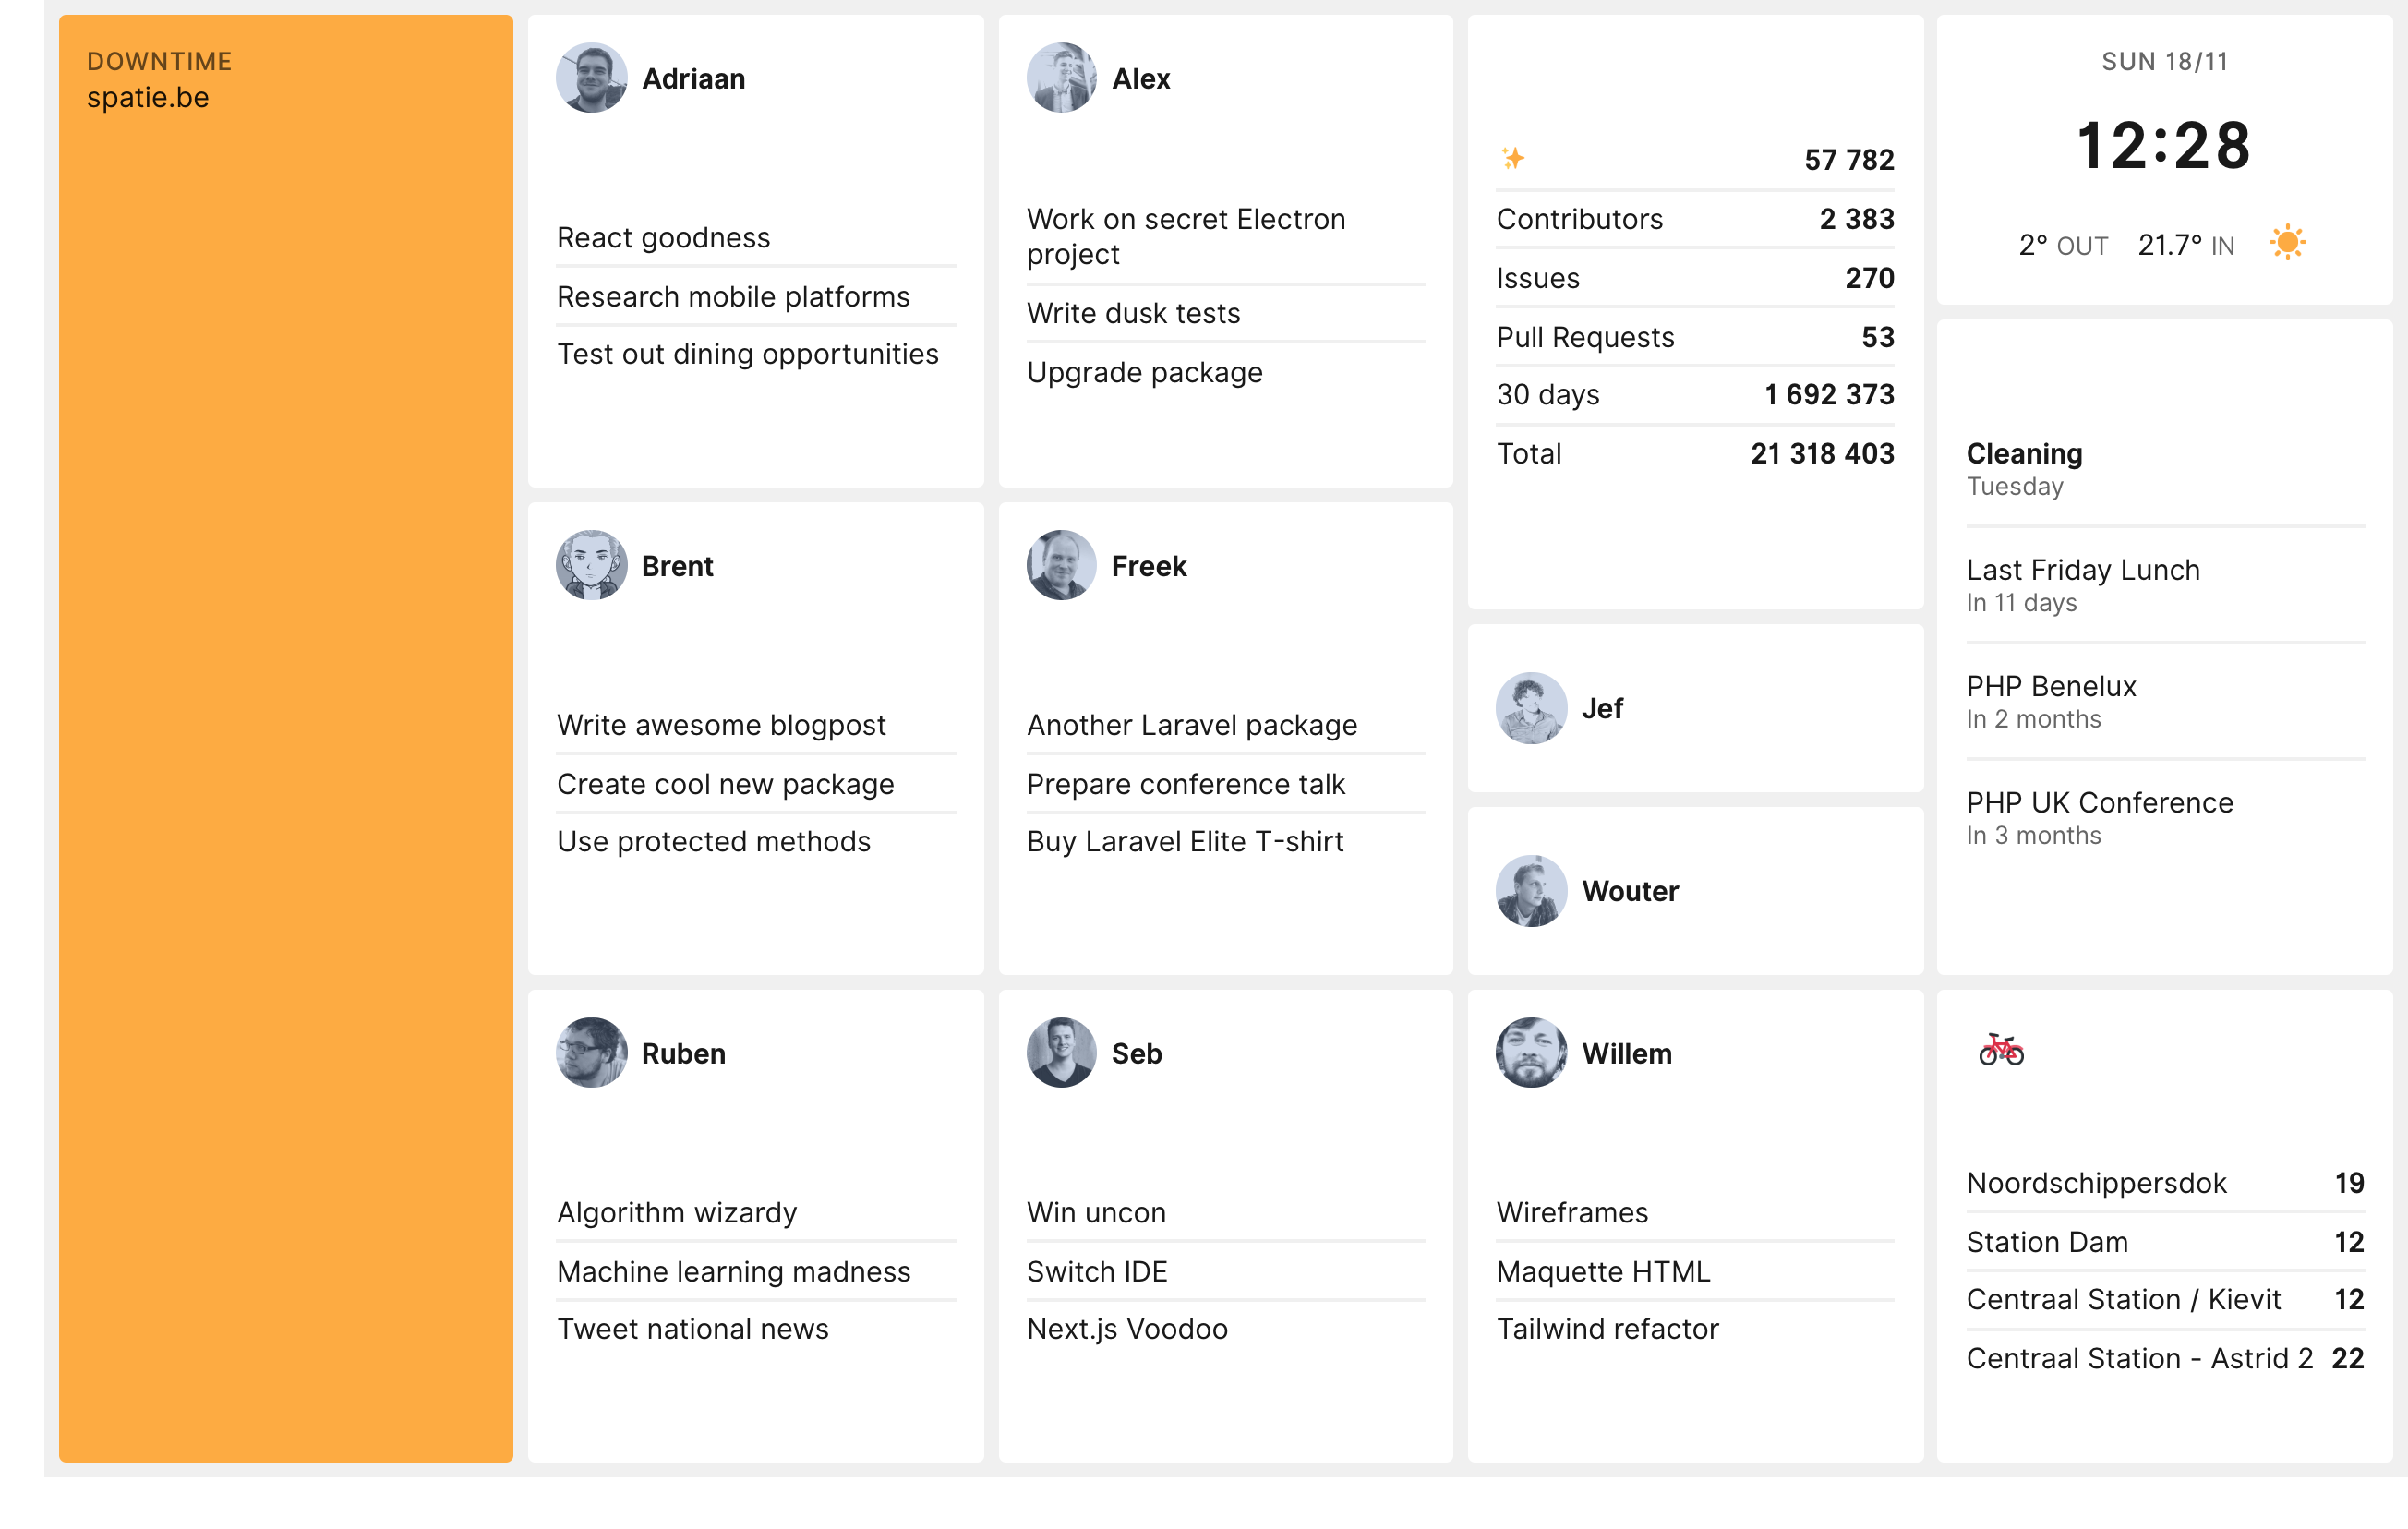
Displaying sites that are down
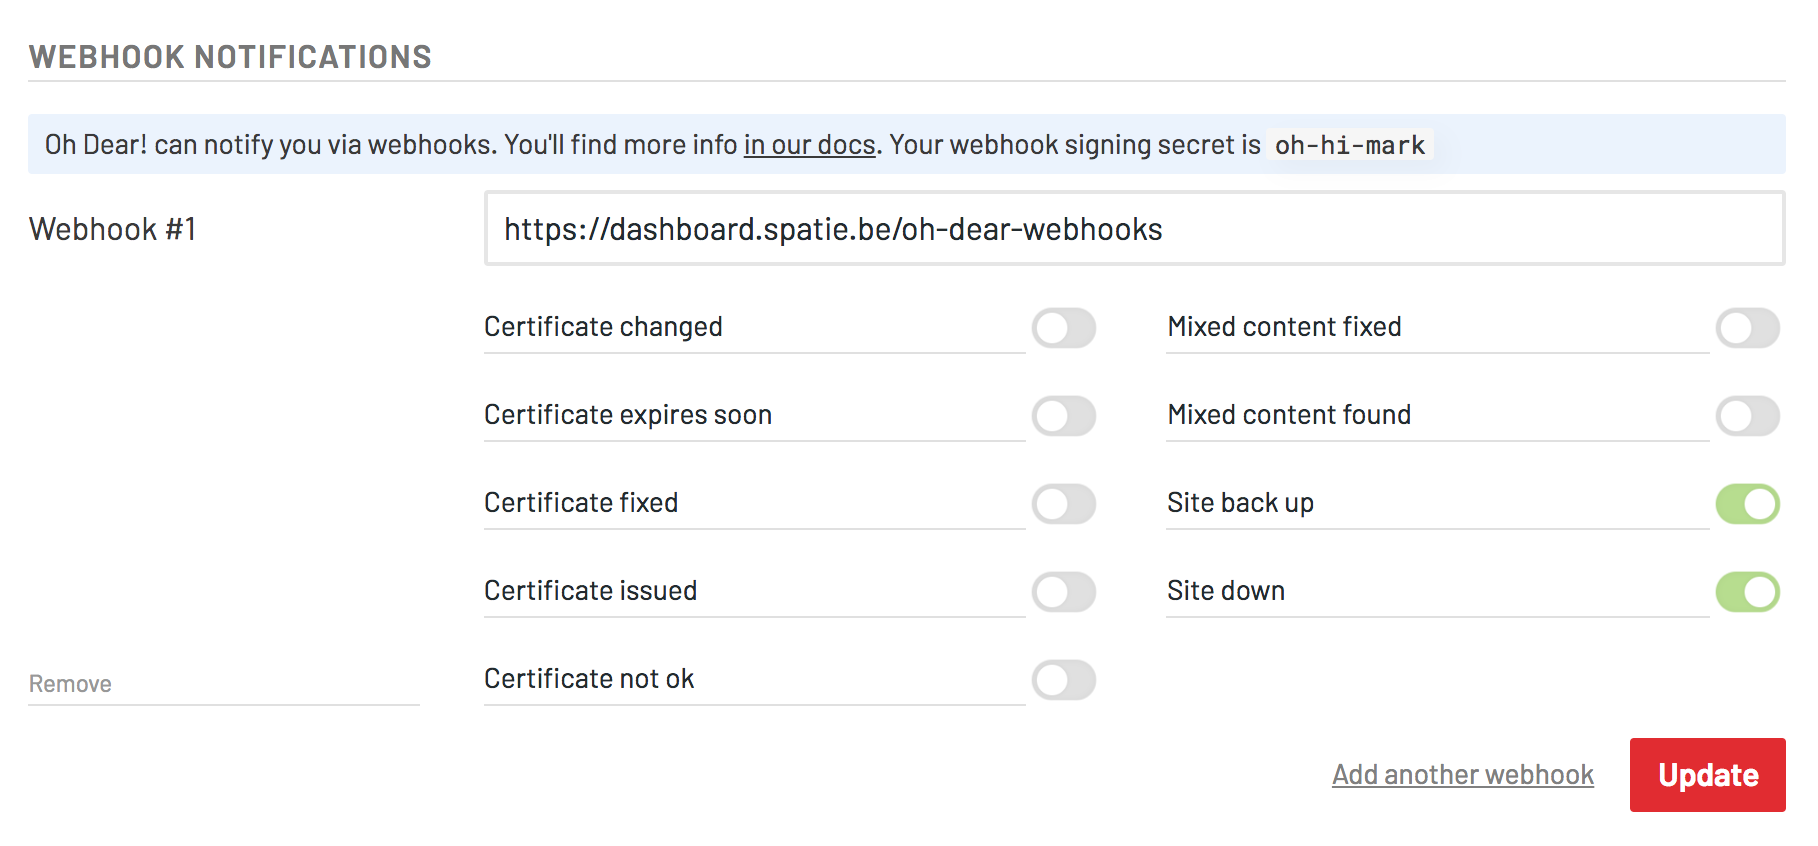
Another thing that the dashboard displays are the urls of client sites that are down. Behind the scenes, it leverages the webhooks from Oh Dear!, a website monitoring service that Mattias Geniar and I launched a while ago.
This is how the dashboard looks like when one or more of our client sites are down.
Let's take a look at how this works behind the scenes. When logged into Oh Dear! go to the notifications screen to set up a webhook. I've entered the URL of our dashboard (that webhook secret in the screenshot isn't the real secret).
To easily handle Oh Dear! webhook calls our dashboard uses the ohdearapp/laravel-ohdear-webhooks package In the routes file there's a route where the Oh Dear! events will be received.
Route::ohDearWebhooks('/oh-dear-webhooks');
When Oh Dear! detects that one of the sites it is monitoring has a problem, it will call /oh-dear-webhooks. Depending on the type of the problem is will fire off certain events. Here is the code of the actual event subscriber in our dashboard.
namespace App\Services\OhDearWebhooks;

use Illuminate\Events\Dispatcher;
use App\Events\Uptime\UptimeCheckFailed;
use App\Events\Uptime\UptimeCheckRecovered;
use OhDear\LaravelWebhooks\OhDearWebhookCall;

class EventSubscriber
{
    public function onUptimeCheckFailed(OhDearWebhookCall $ohDearWebhookCall)
    {
        $site = $ohDearWebhookCall->site();

        event(new UptimeCheckFailed($site['id'], $site['url']));
    }

    public function onUptimeCheckRecovered(OhDearWebhookCall $ohDearWebhookCall)
    {
        $site = $ohDearWebhookCall->site();

        event(new UptimeCheckRecovered($site['id'], $site['url']));
    }

    public function subscribe(Dispatcher $events)
    {
        $events->listen(
            'ohdear-webhooks::uptimeCheckFailed',
            'App\Services\OhDearWebhooks\EventSubscriber@onUptimeCheckFailed'
        );

        $events->listen(
            'ohdear-webhooks::uptimeCheckRecovered',
            'App\Services\OhDearWebhooks\EventSubscriber@onUptimeCheckRecovered'
        );
    }
}
You can see that when an Oh Dear! event comes in (such as ohdear-webhooks::uptimeCheckFailed) were are going to fire off a new event of our own (for instance UptimeCheckFailed). Our own events extend DashboardEvent which, as explained above, means they will be broadcasted via Pusher to the browser.
This is the code of the Uptime Vue component that receives the events at the client side.
<template>
    <tile
        v-if="hasFailingUrls"
        :position="position"
        class="markup bg-warn"
    >
        <h1>Downtime</h1>
        <ul>
            <li v-for="failing in failingUrls">
                <div class="truncate">{{ failing.url }}</div>
            </li>
        </ul>
    </tile>
</template>
<script>
import echo from '../mixins/echo';
import Tile from './atoms/Tile';
import { formatDuration } from '../helpers';

export default {
    components: {
        Tile,
    },

    filters: {
        formatDuration,
    },

    mixins: [echo],

    props: ['position'],

    data() {
        return {
            failingUrls: [],
        };
    },

    computed: {
        hasFailingUrls() {
            return this.failingUrls.length > 0;
        },
    },

    methods: {
        getEventHandlers() {
            return {
                'Uptime.UptimeCheckFailed': response => {
                    this.add(response.url);
                },
                'Uptime.UptimeCheckRecovered': response => {
                    this.remove(response.url);
                },
                'Uptime.UptimeCheckSucceeded': response => {
                    this.remove(response.url);
                },
            };
        },

        add(url) {
            this.failingUrls = this.failingUrls.filter(failingUrl => url !== failingUrl.url);

            this.failingUrls.push({ url });
        },

        remove(url) {
            this.failingUrls = this.failingUrls.filter(failingUrl => url !== failingUrl.url);
        },
    },
};
</script>
As soon as there is one failingUrl that the Uptime tile is being displayed.
Integrating Oh Dear! webhooks in your applications isn't difficult at all. You'll find more info on the webhooks package in the Oh Dear! documention.
Security
Because there is some semi-sensitive info being displayed (the tasks of our team members and the events on the calendar) we've added some security to the dashboard. That's why you can't just visit https://dashboard.spatie.be.
The URL itself is protected by a basic auth filter on the routes. Relying on basic auth can be a bit insecure. So if you are going to fork our dashboard be sure to pick a long password and do some rate limiting server side to prevent brute force attacks.
The data sent through the webSockets is secured as well. In the Echo mixin, you might have noticed that a private method is called. This will ensure that, under the hood, a private Pusher channel is used so nobody can listen in to what is sent via the webSockets.
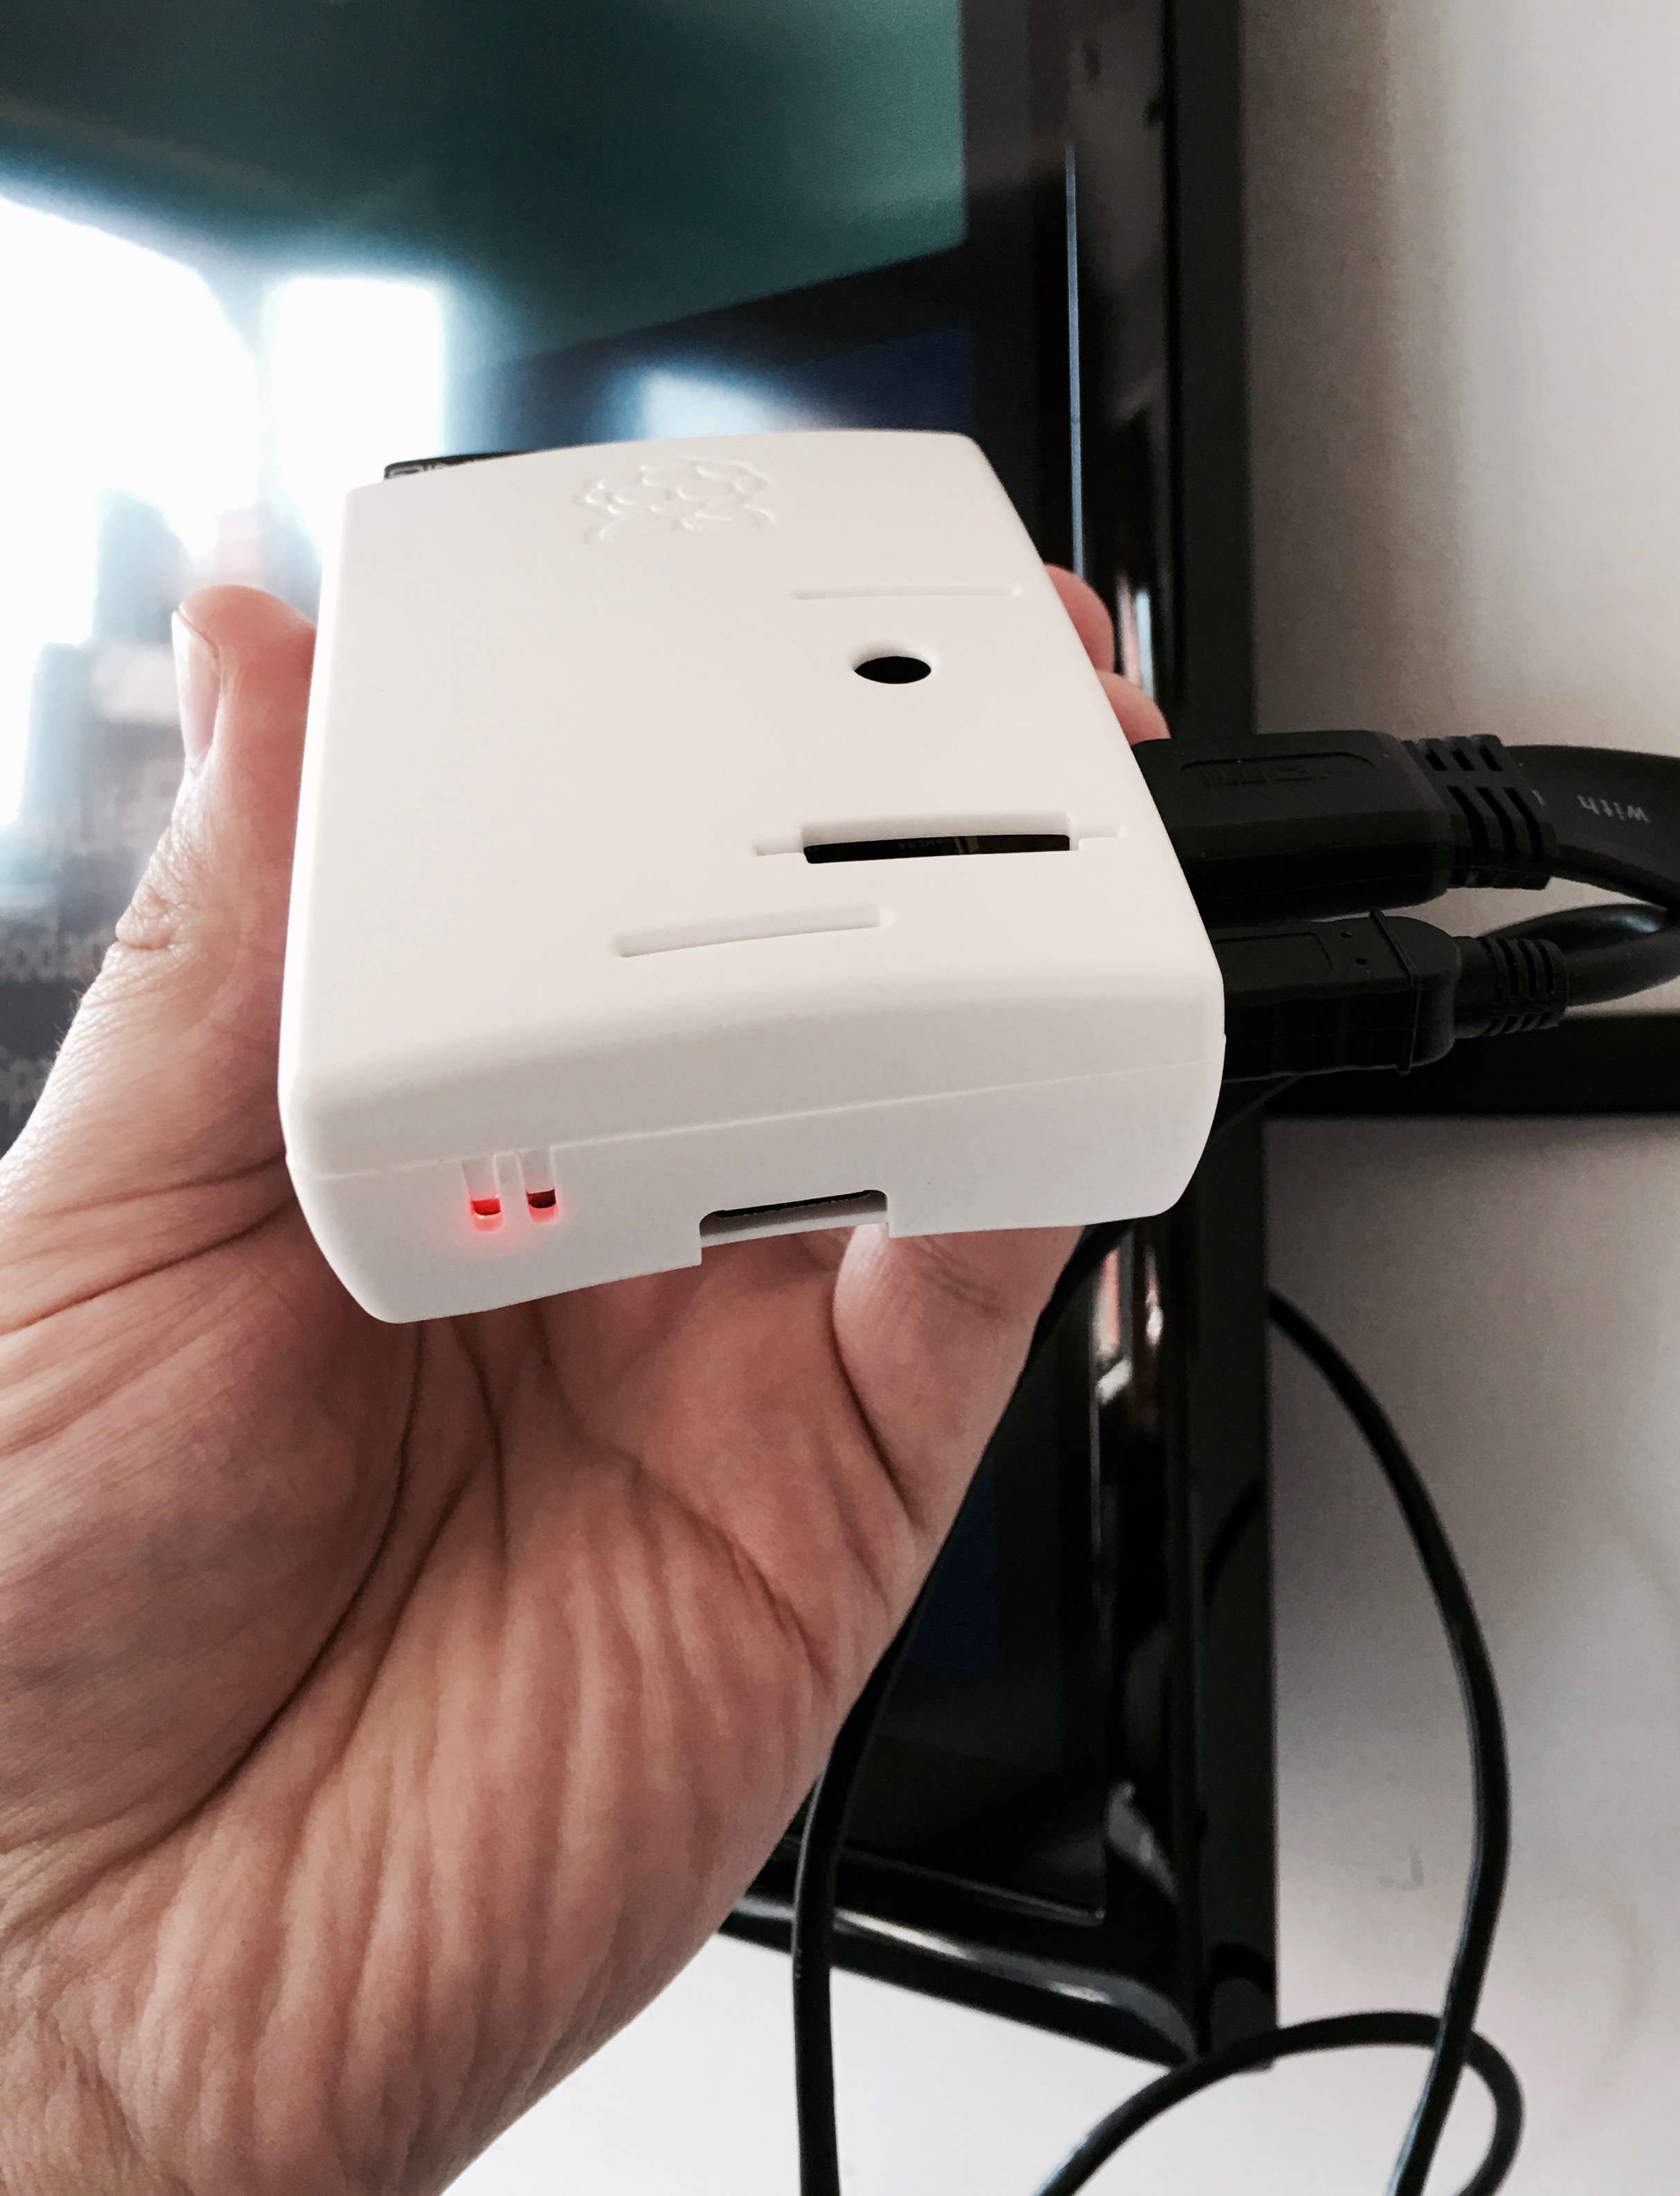
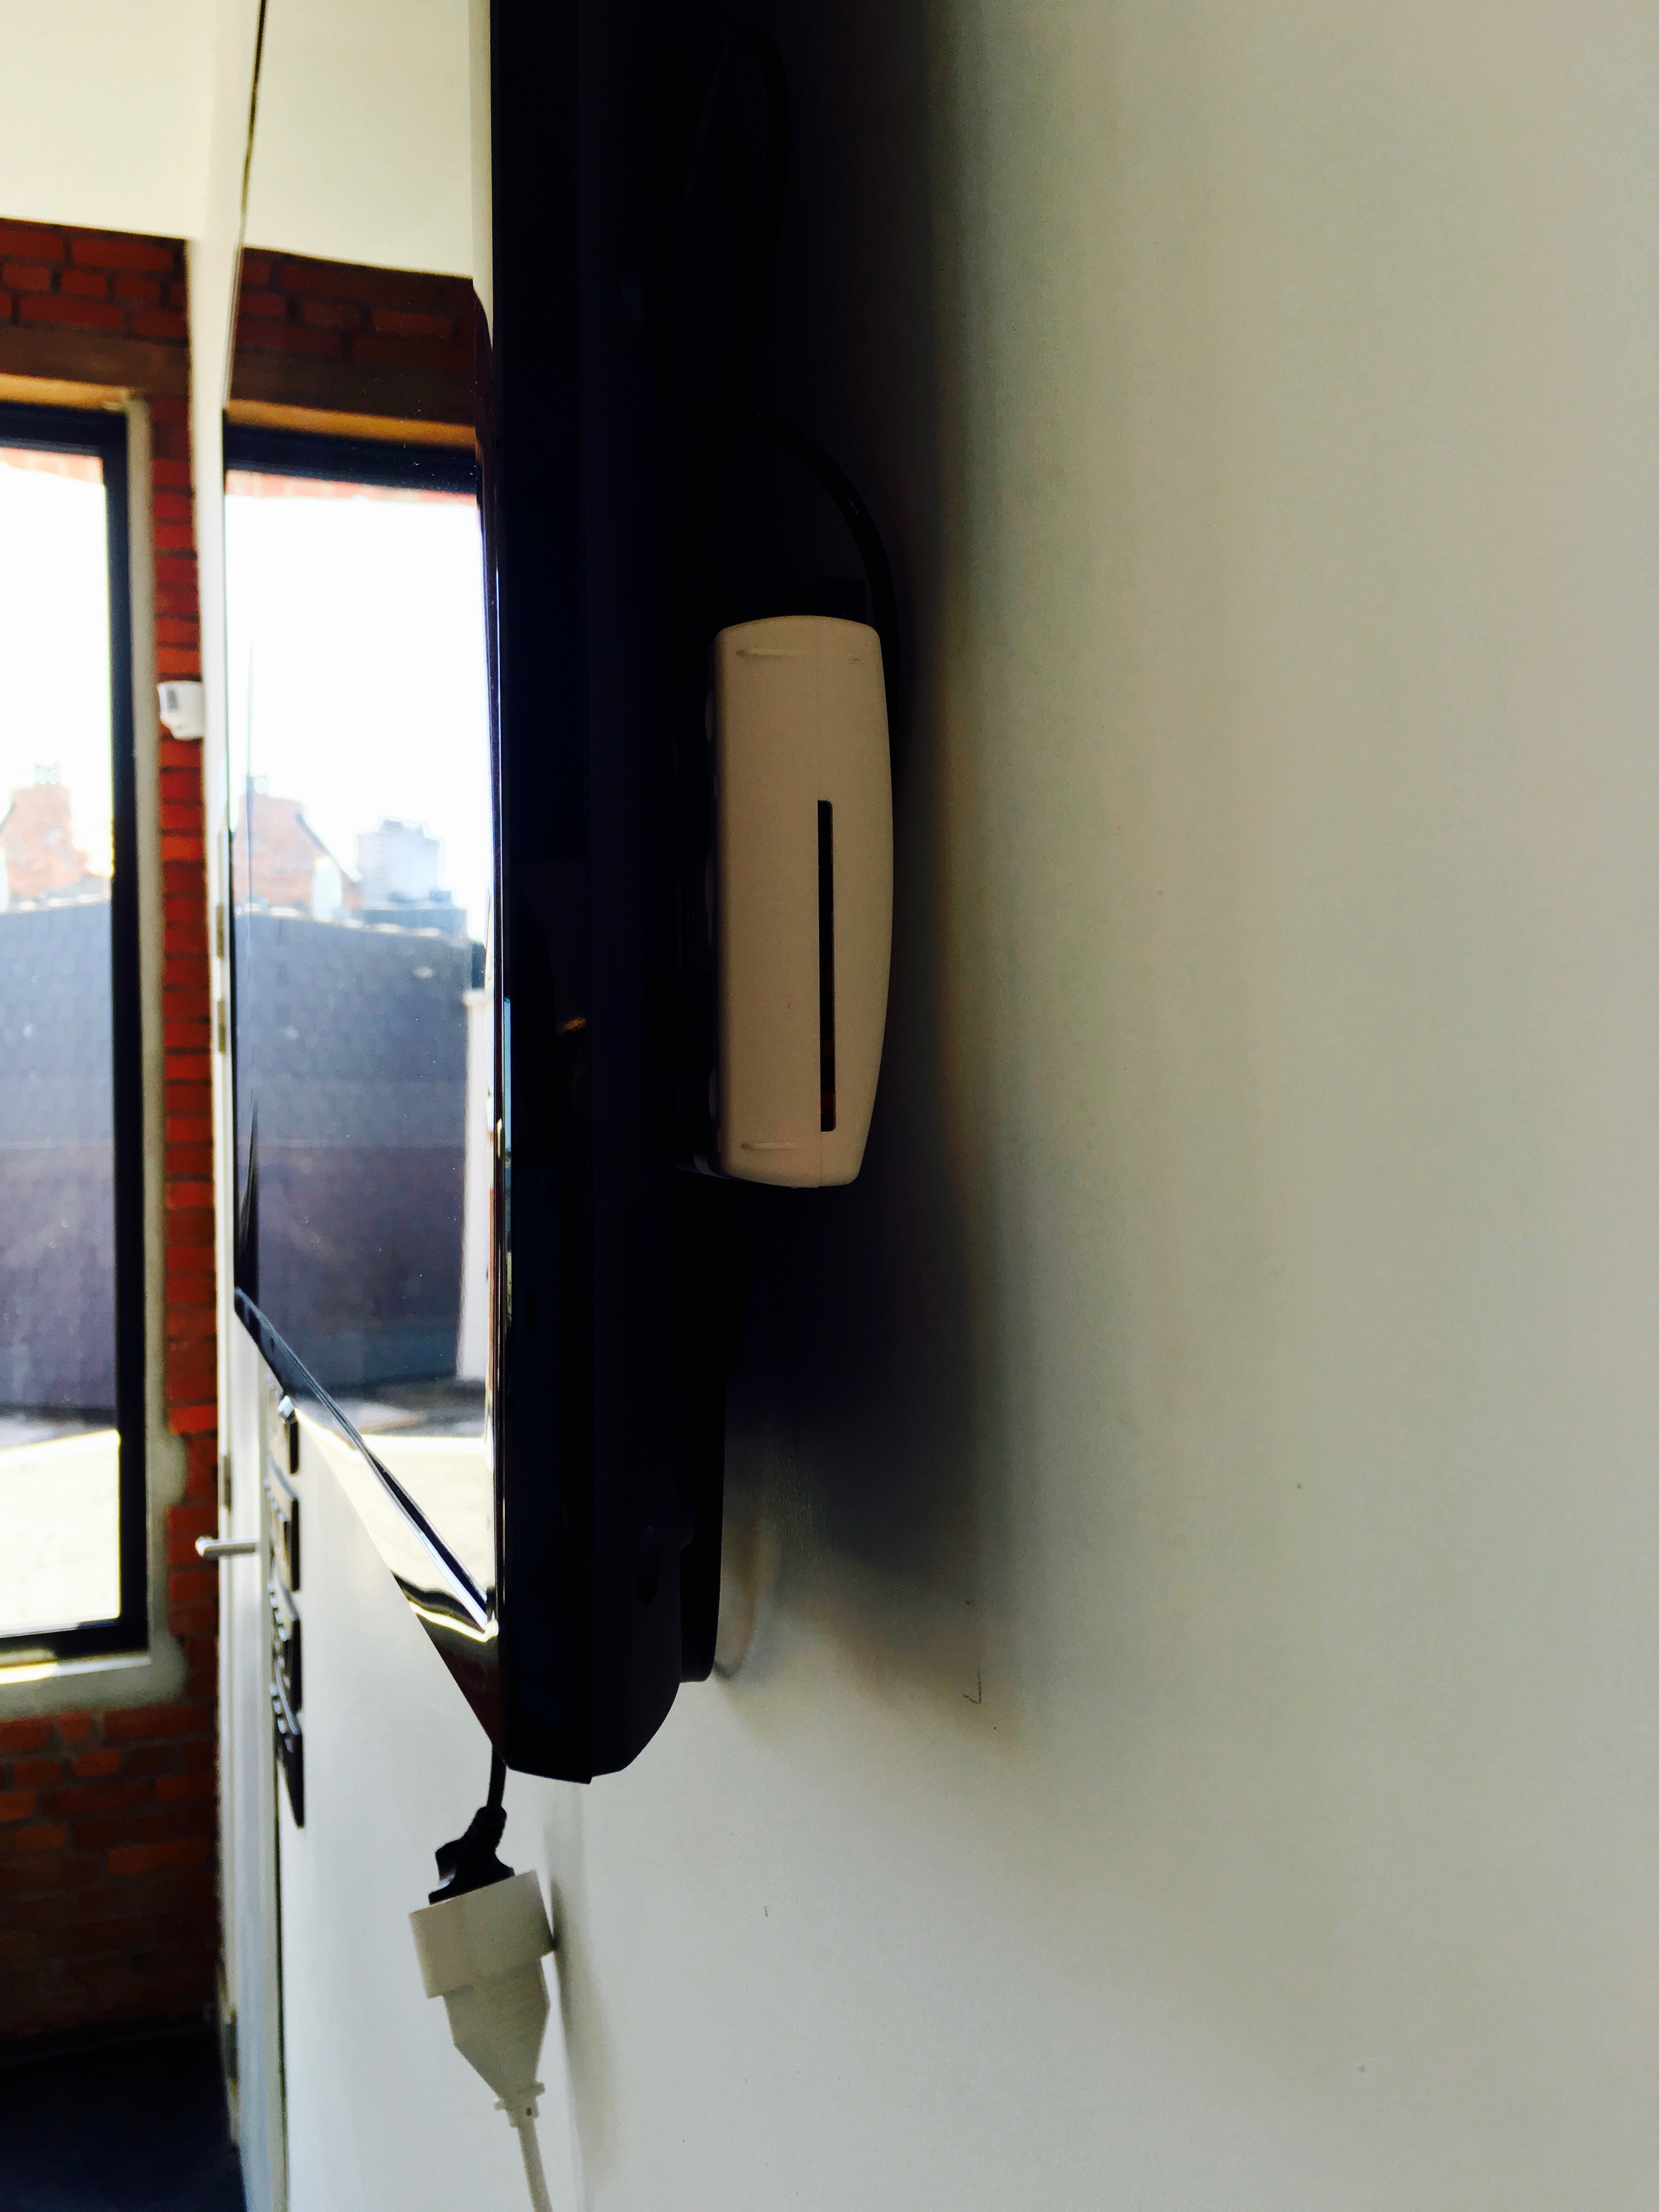
Displaying the dashboard on a TV
Behind our tv there is a Raspberry Pi 2 that displays the dashboard. It is powered by a USB port in the tv and it has a small Wifi dongle to connect to the internet, so cables aren't necessary at all.
The Pi used the default Raspian OS. When it is powered on it'll automatically launch Chromium 56 and display the contents of https://dashboard.spatie.be.
Reloading the dashboard
For most components, the communication between the server and client is one-way. The client will receive data solely through the events sent out by the server. The client will never make a request for data itself.
When our last team member leaves the office he will switch off the wall mounted TV. This will cause the Pi to be powered down as well. The next time when the tv is powered back on the dashboard will be empty, waiting for events sent out by the server. We don't want to stare at an empty dashboard the first hour after the tv is powered on, let's fix that.
Every Vue component preserves its own state in data. Wouldn't it be great to save that data whenever it is changed? Then it could be reloaded whenever the dashboard gets powered on. The SaveState-mixin, which is used on almost every Vue component, does exactly that.
The mixin watches the data of the component it's applied to. Whenever data changes, it will serialize the data and write it to local storage. Afterward, when the component is created, the mixin will restore its state with the values in local storage. This means that when we power on our tv the saved data will immediately be displayed.
We've extracted that mixin to its own package so you can use it in your projects: spatie/vue-save-state
Packages used
The dashboard is fetching data from various sources: Google Calendar, Packagist, Lastfm,... Here's the list of packages used to pull in the data:
- spatie/last-fm-now-playing: Get info on a track that user is currently playing
- spatie/laravel-google-calendar: The easiest way the not only read but also write to a Google Calendar via PHP.
- KnpLabs/github: read data from GitHub.
- spatie/packagist-api: fetch statistics on PHP Packages.
- spatie/laravel-twitter-streaming-api: listen for mentions and quotes on Twitter in real-time.
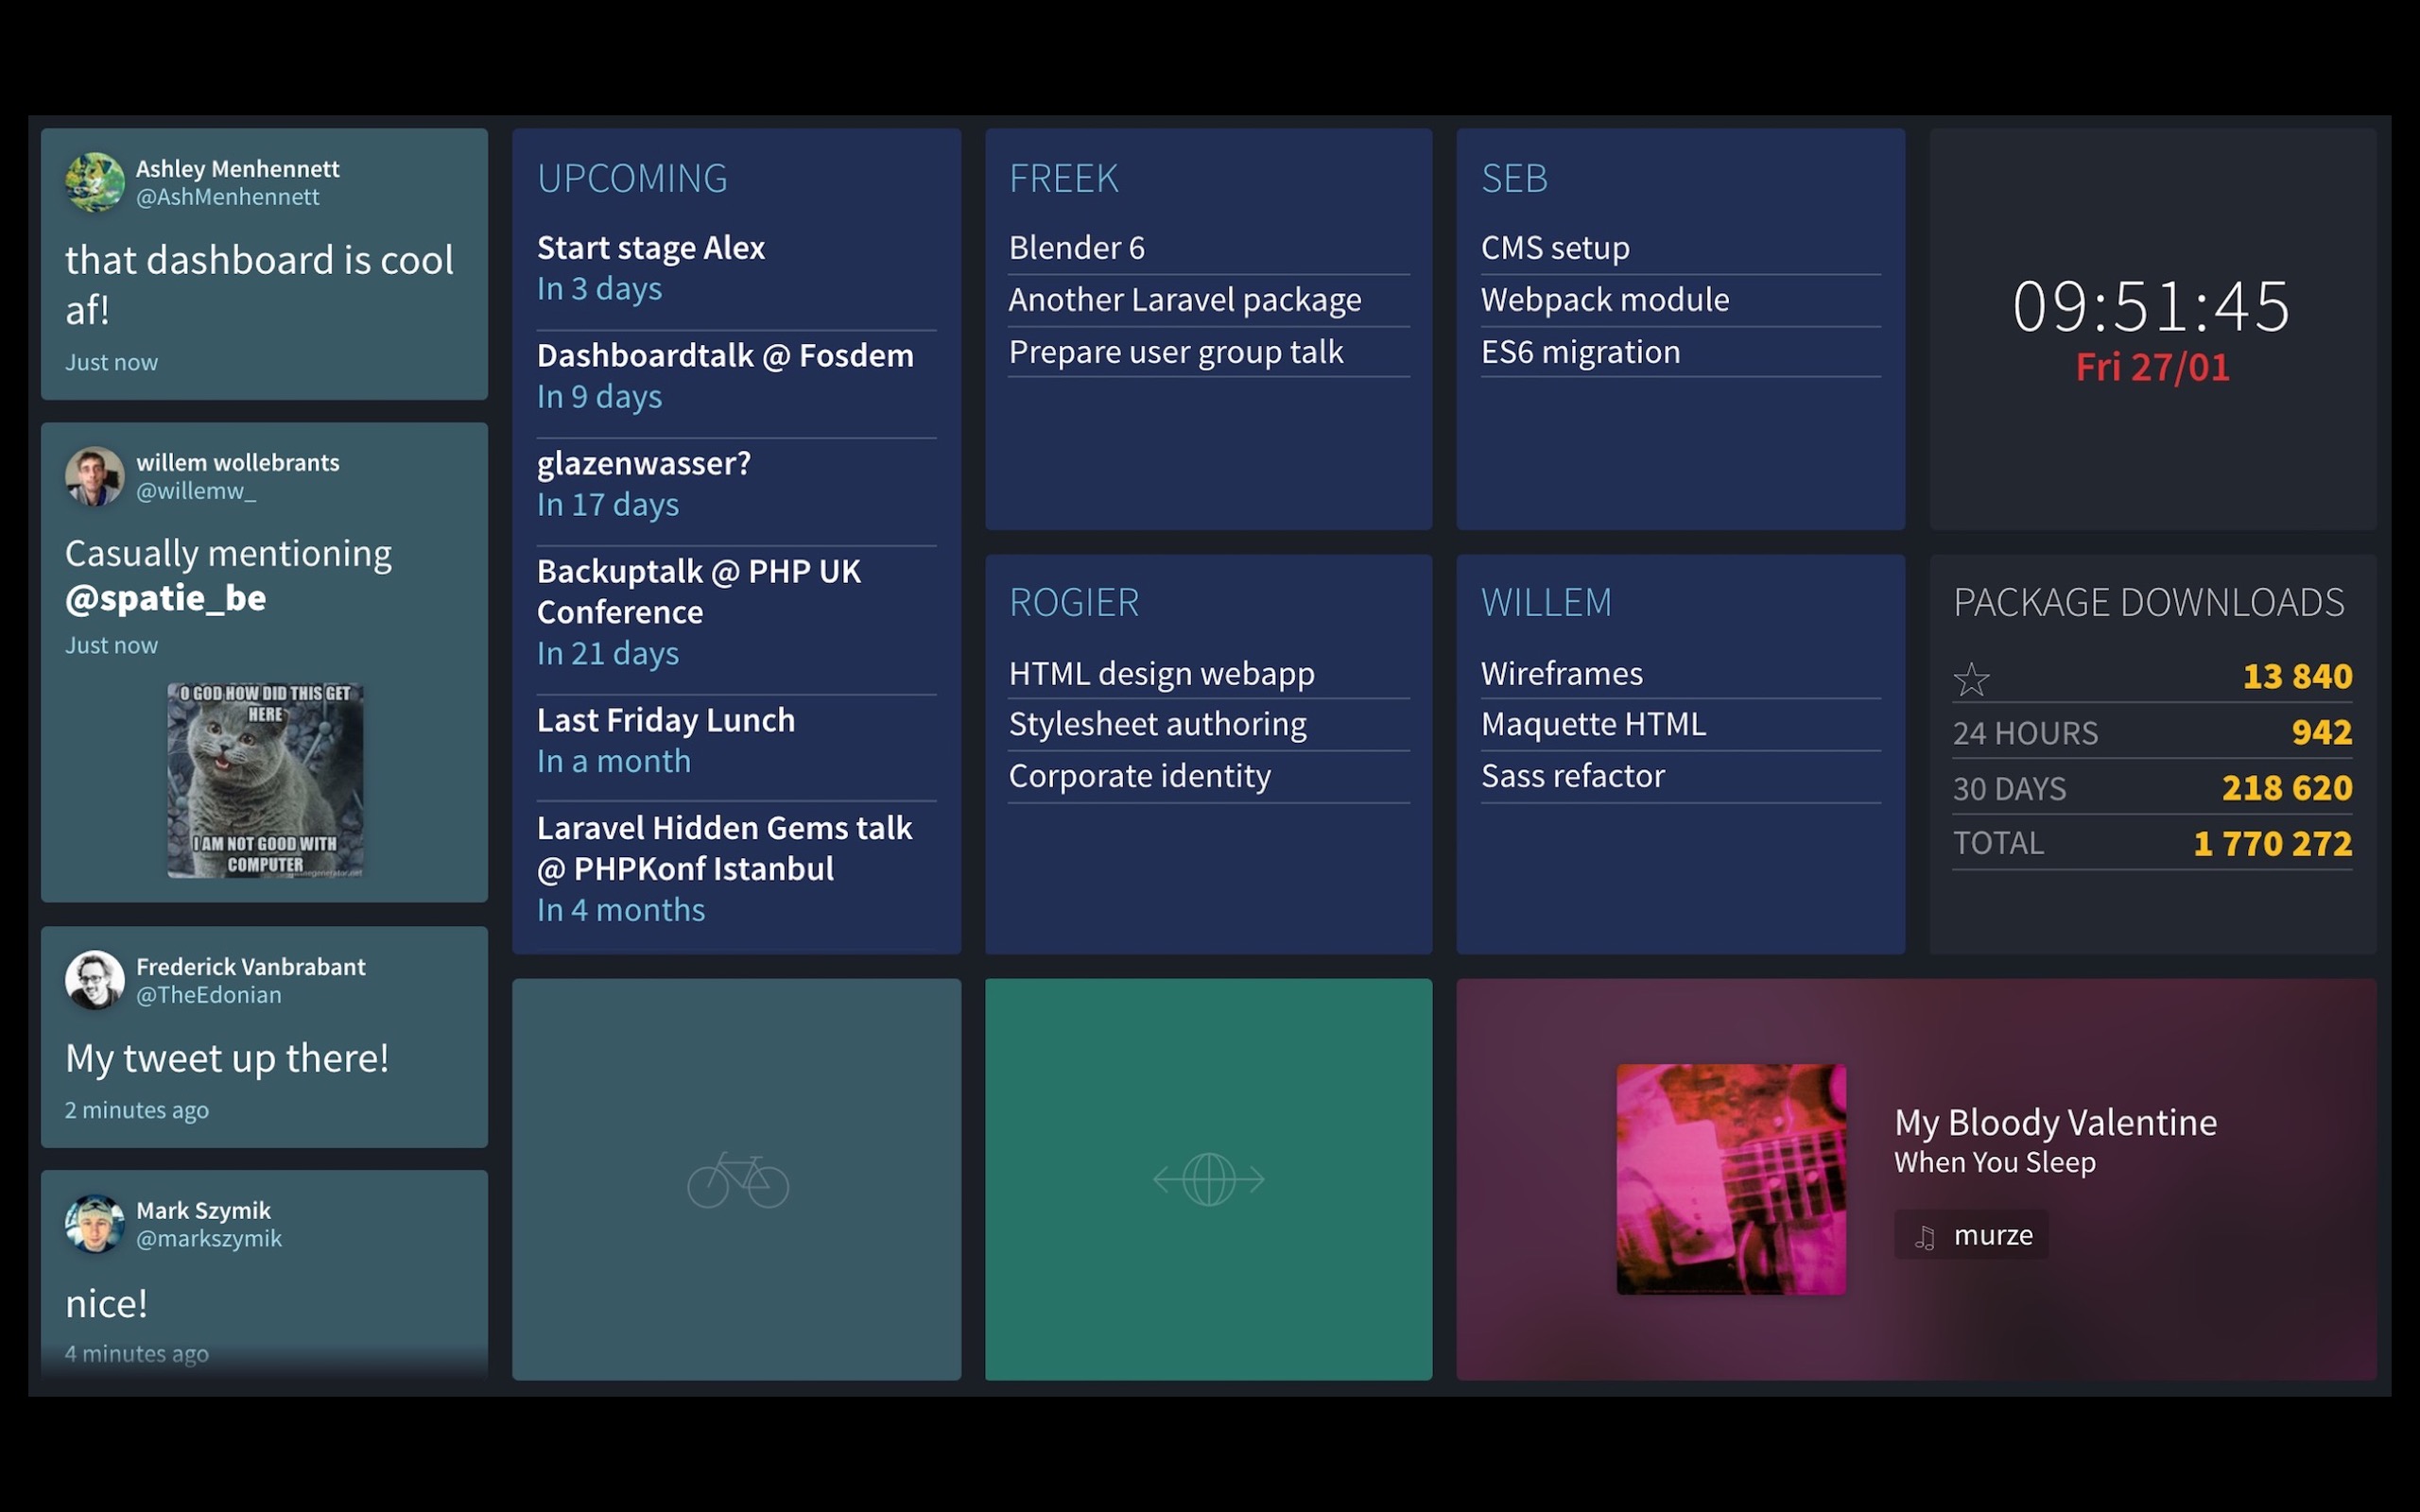
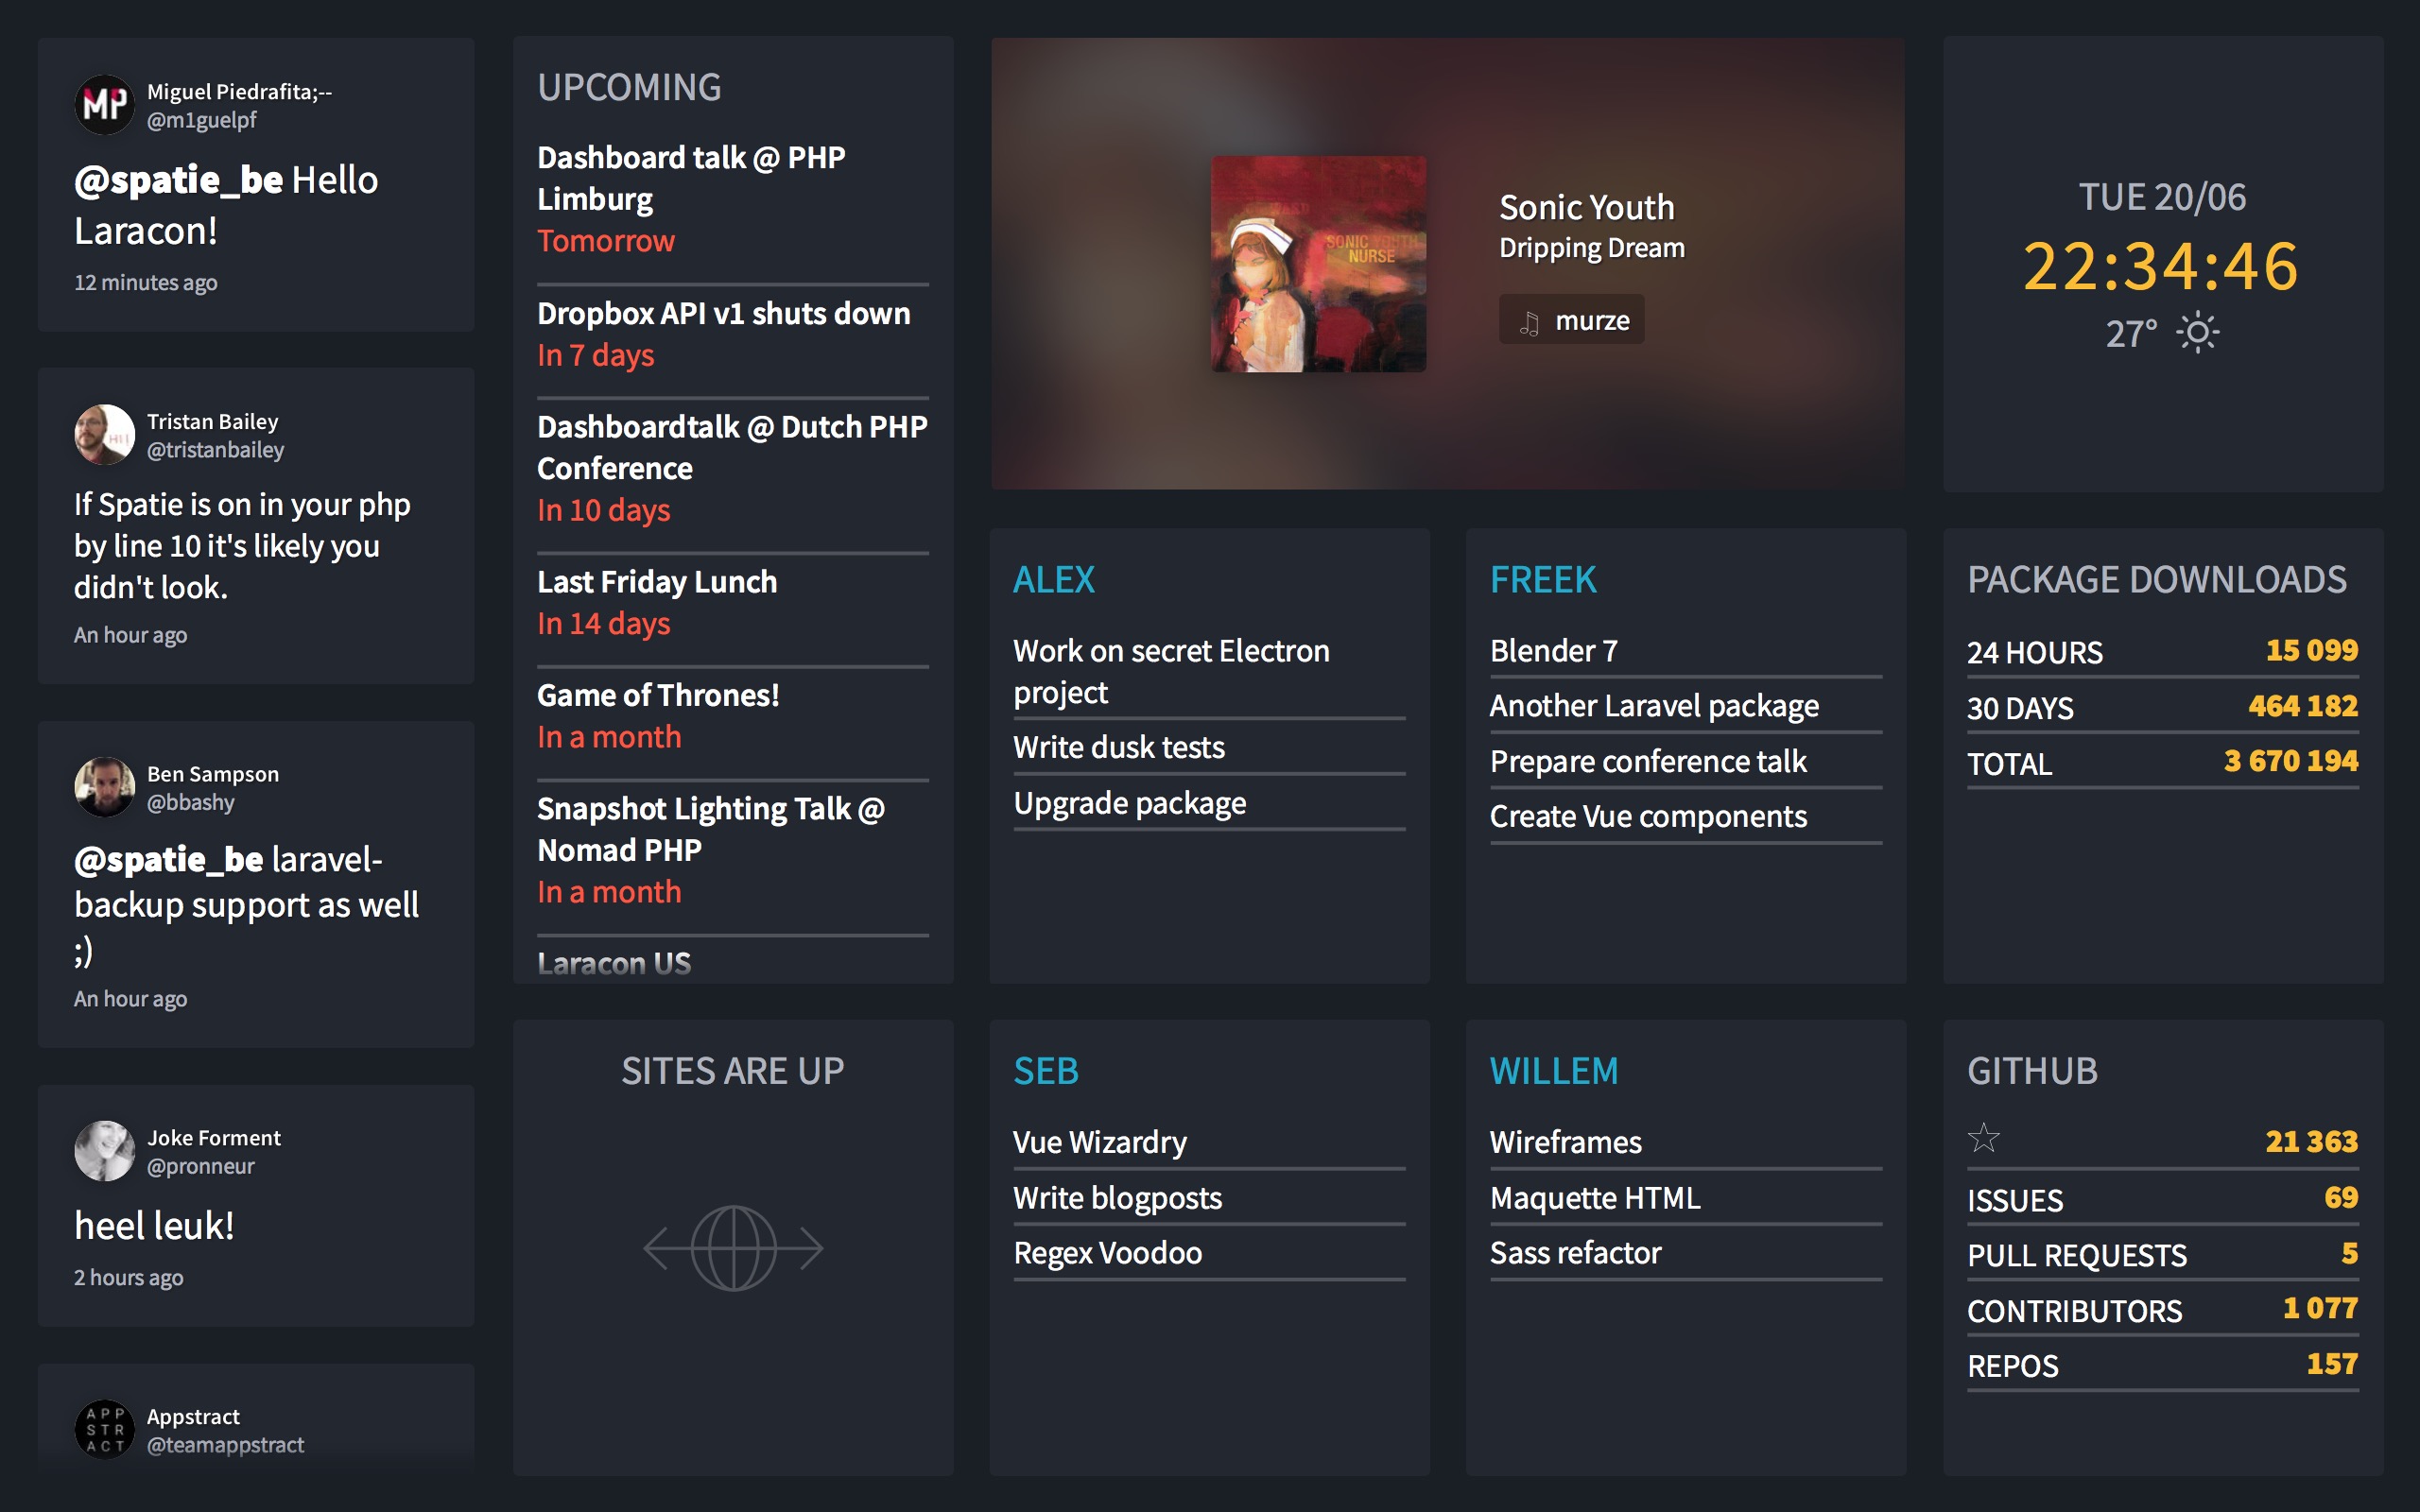
Previous iterations
We created our dashboard a couple of years ago. Every year we iterate on it. Here are some screenshots from the very first version up until the most current one.

Closing notes
I hope that you've enjoyed this little tour of the code behind our dashboard. I don't have the intention of creating full documentation for the dashboard and make it monkey-proof as that would require just too much time. On the other hand, I do think that if you have some experience with Laravel and Vue it's not that hard to make your own dashboard with our code.
The entire source code is available on GitHub. If you have any questions on the dashboard, feel free to ask them in the comments below.