Displaying sites that are down on a dashboard using Oh Dear! webhooks original
At Spatie we have a dashboard against the wall that displays a lot of information useful for our company. One of the things it shows are the urls of client sites that are down. Behind the scenes it leverages the webhooks from Oh Dear!, a website monitoring service that Mattias Geniar and I launched a few weeks ago.
In this blogpost I'd like to show how all of this works.
The dashboard
Spatie's dashboard is a Laravel / Vue application. It's open sourced. You'll find the actual code that's deployed to our server in this repo on GitHub.
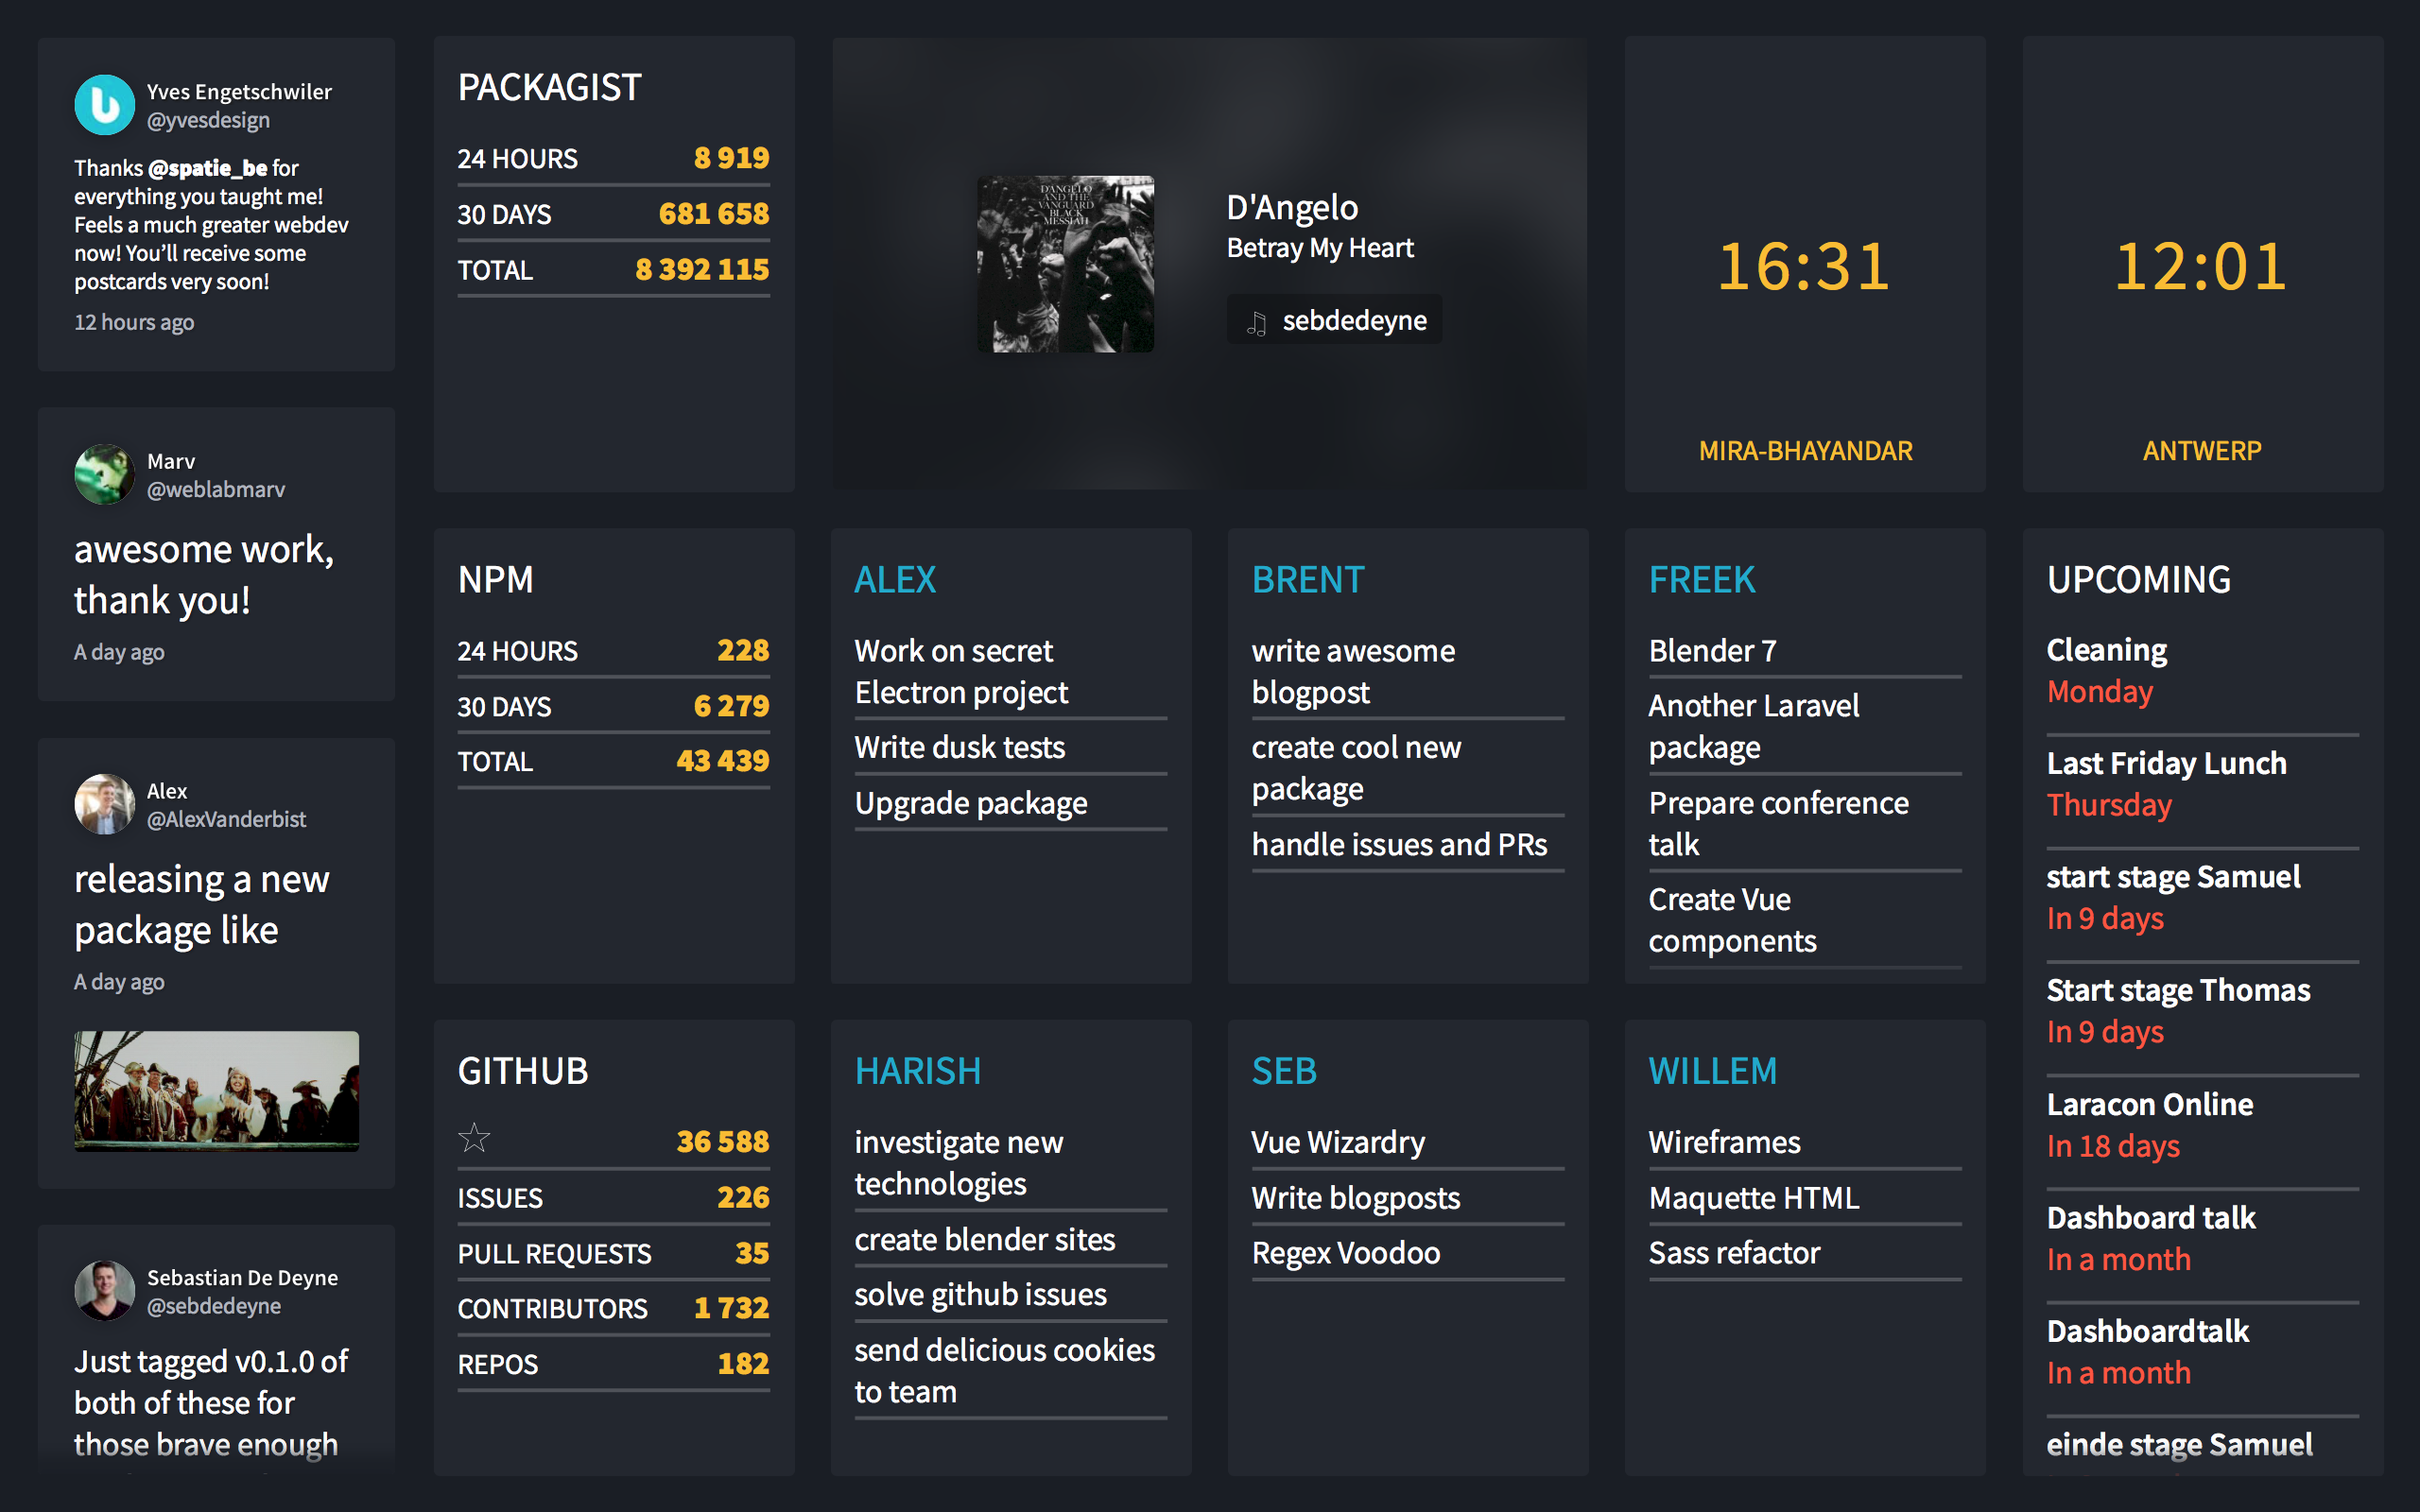
Here's how our dashboard looks like.

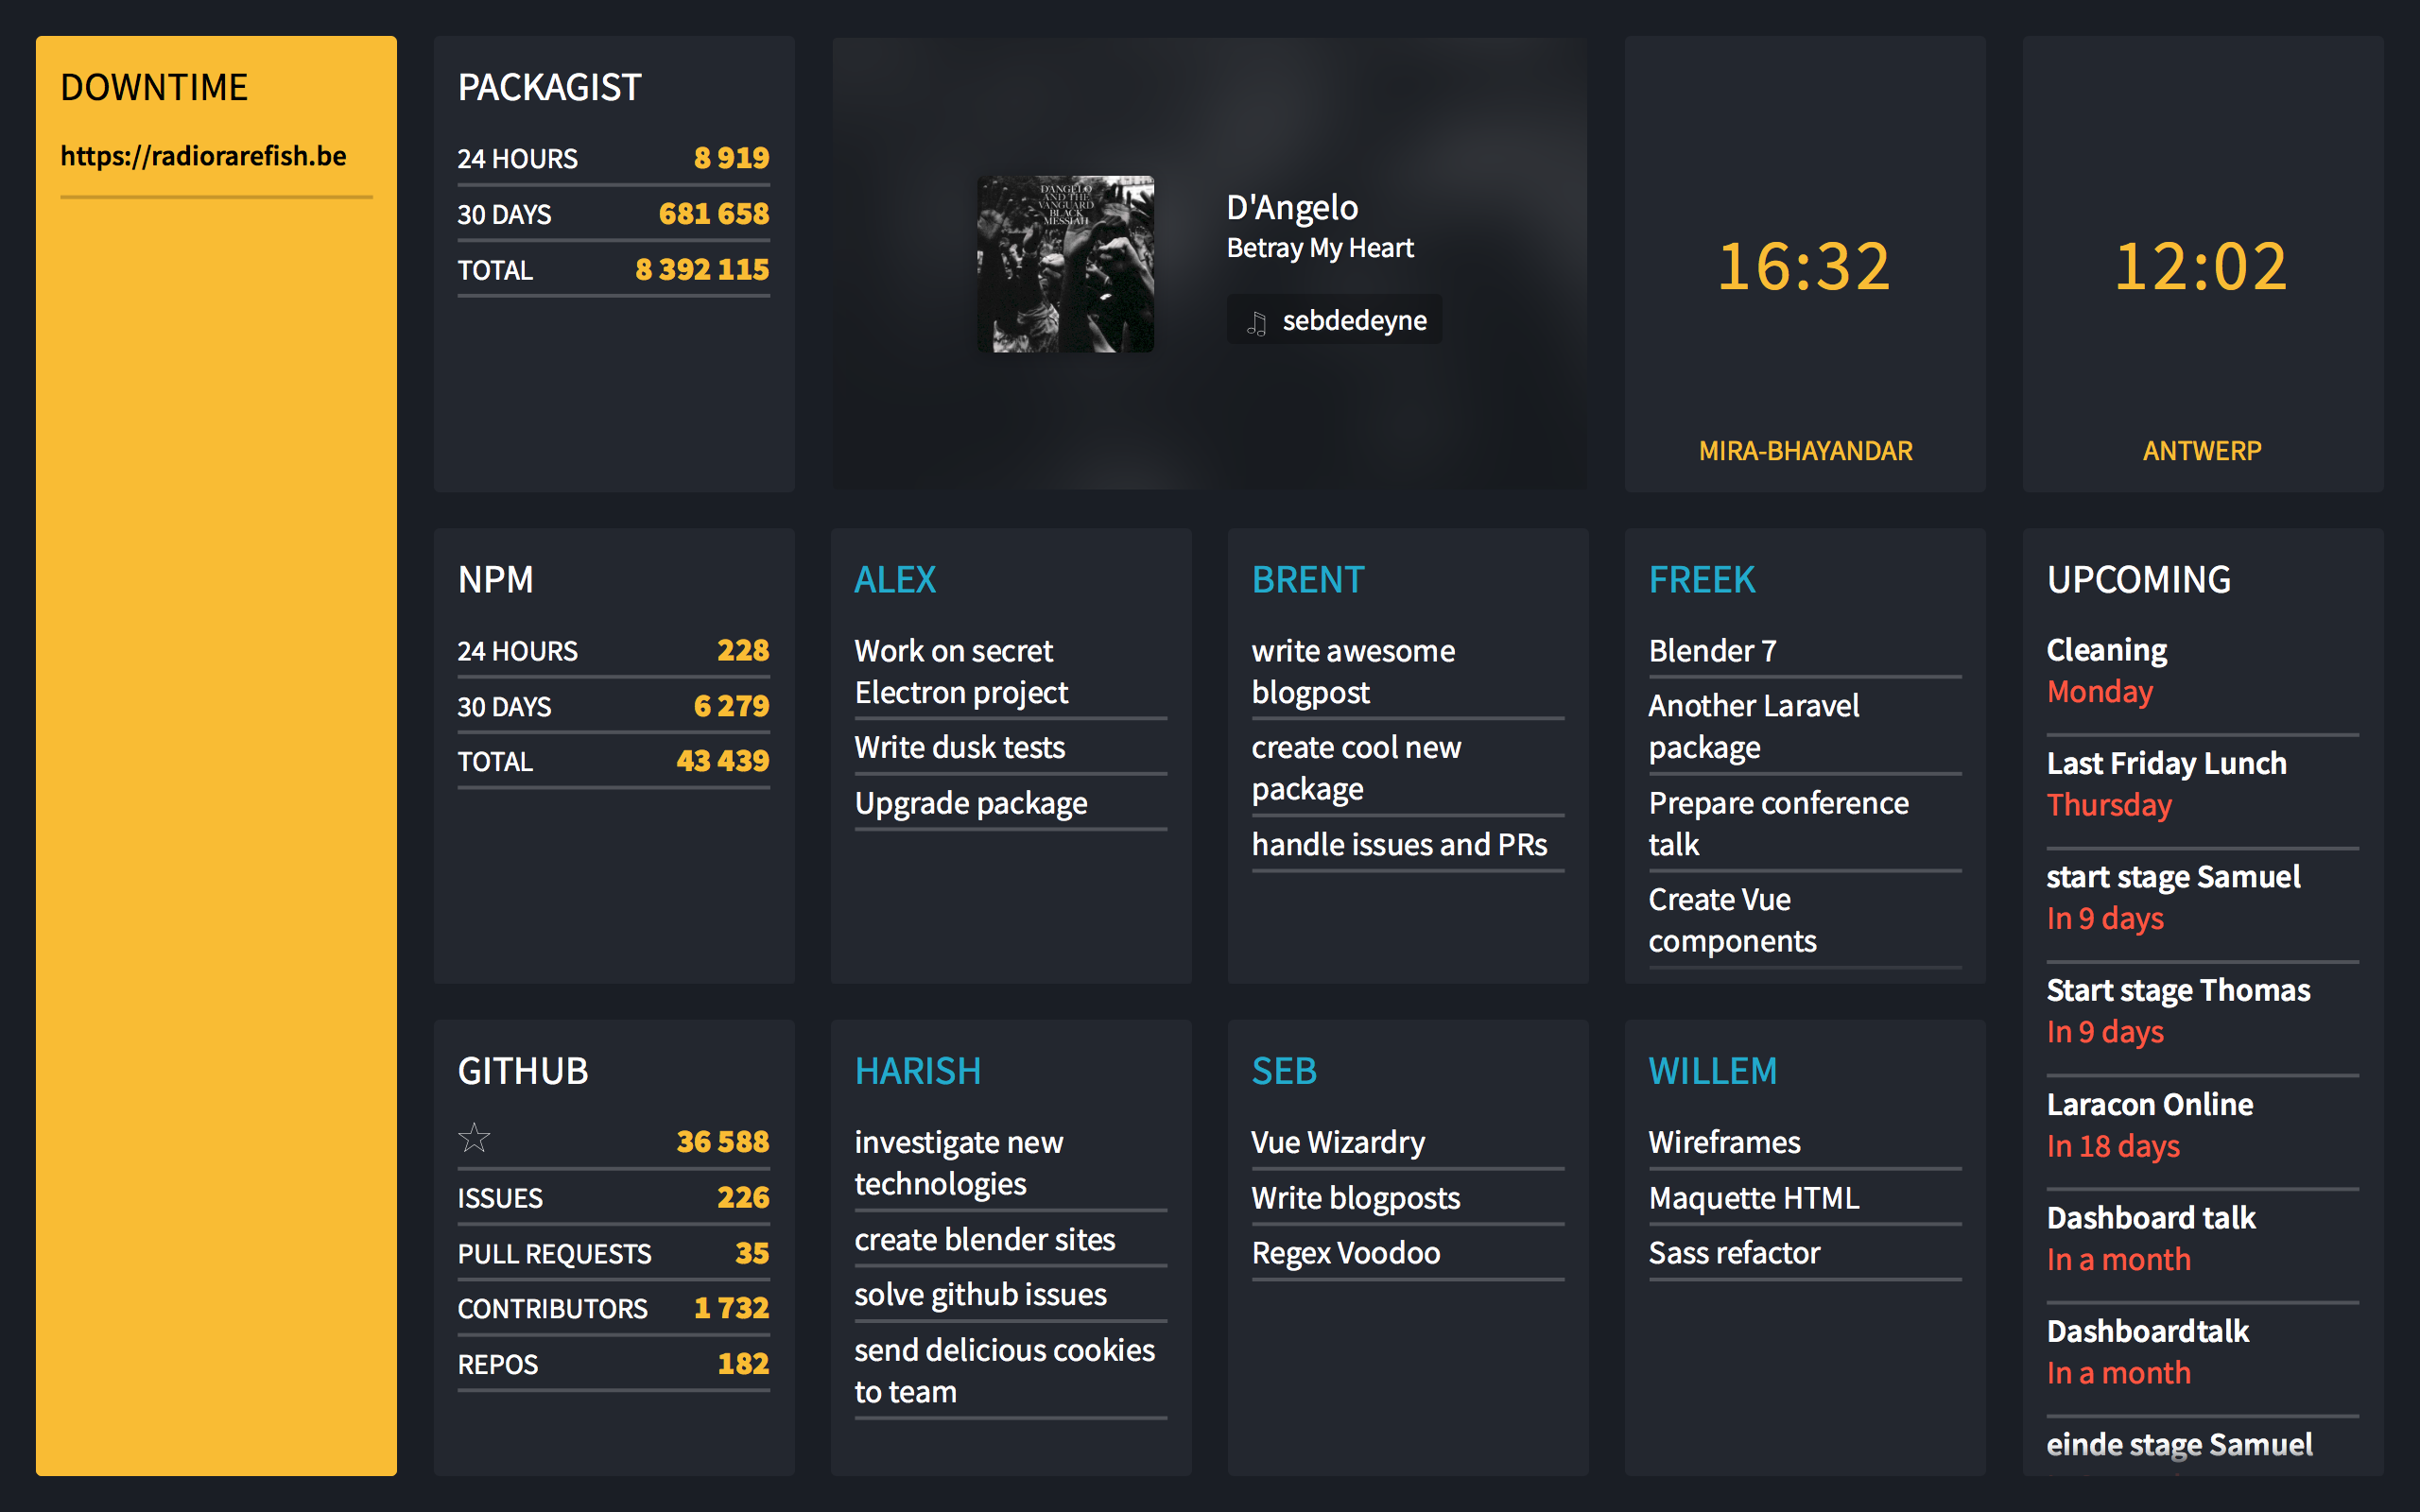
And this is what it looks like when one of our sites is down.

Before continuing you should read this blogpost or watch the video of my Laracon EU 2017 talk to know how the dashboard works.
Integrating Oh Dear! webhooks
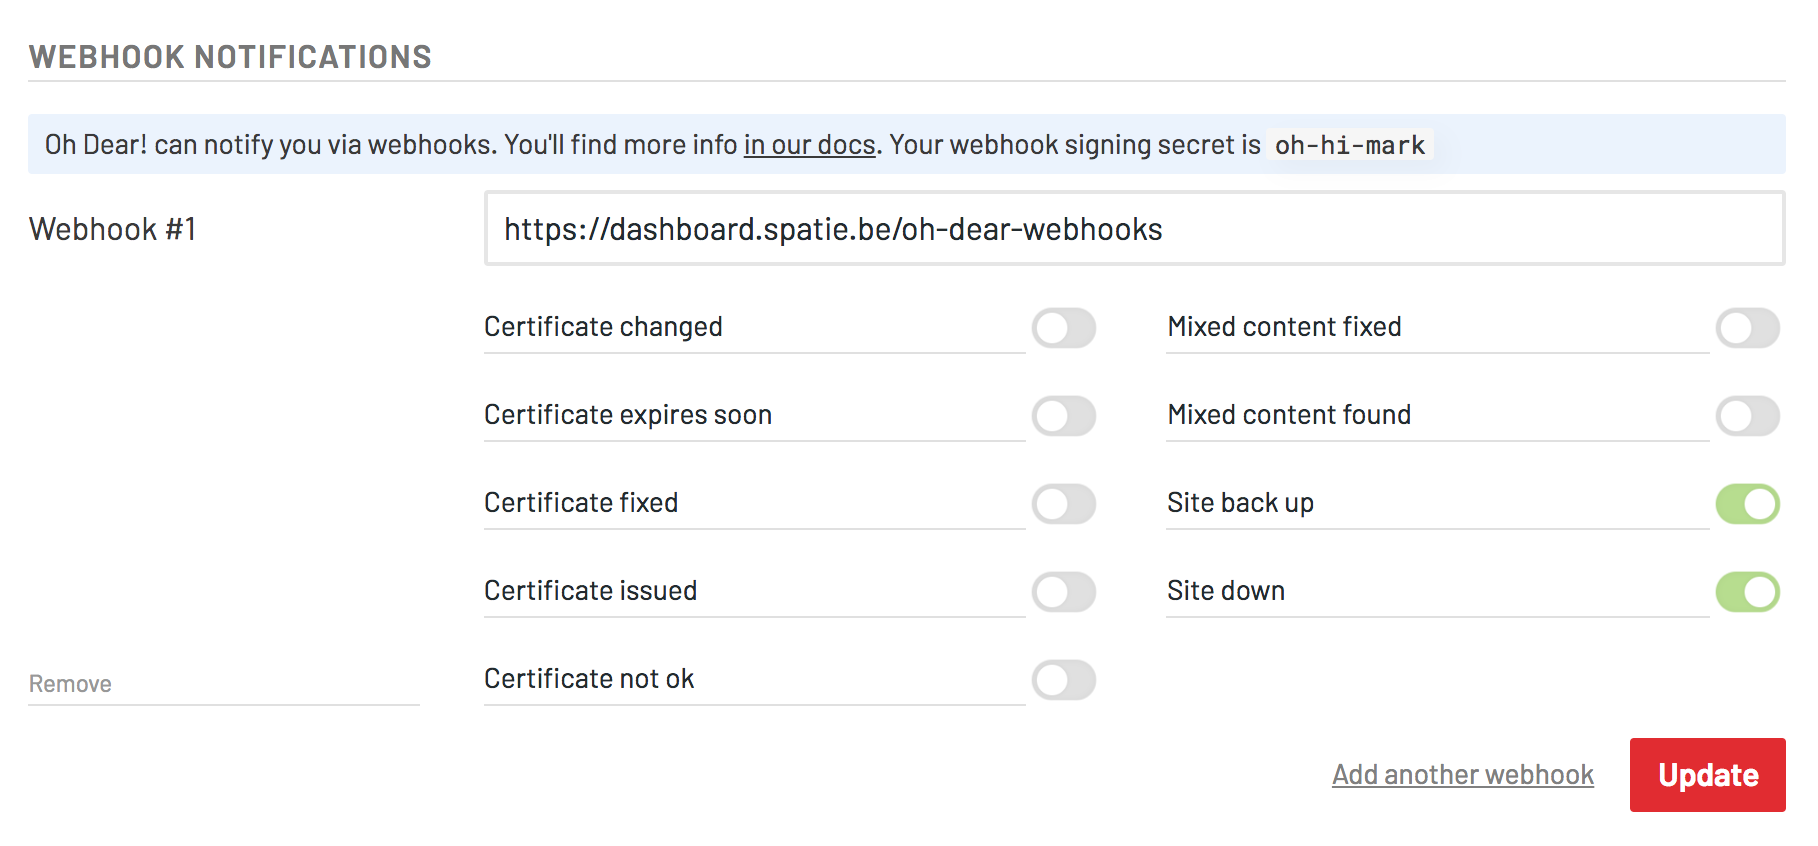
Logged into Oh Dear! notifications screen a webhook can be setup. If entered the url of our dashboard (that webhook secret in the screenshot isn't the real secret).

To easily handle Oh Dear! webhook calls in a Laravel app the ohdearapp/laravel-ohdear-webhooks package can be used. Once installed and the initial setup is out of the way you can listen for Oh Dear! events.
In the routes file there's a route where the Oh Dear! events will be received.
Route::ohDearWebhooks('/oh-dear-webhooks');
When Oh Dear! hits that route certain events will get fired off in the app. You can define an event handler to handle those events. Here is the code of the actual event handler in our dashboard.
namespace App\Services\OhDearWebhooks;

use Illuminate\Events\Dispatcher;
use App\Events\Uptime\UptimeCheckFailed;
use App\Events\Uptime\UptimeCheckRecovered;
use OhDear\LaravelWebhooks\OhDearWebhookCall;

class EventSubscriber
{
    public function subscribe(Dispatcher $events)
    {
        $events->listen(
            'ohdear-webhooks::uptimeCheckFailed',
            'App\Services\OhDearWebhooks\EventSubscriber@onUptimeCheckFailed'
        );

        $events->listen(
            'ohdear-webhooks::uptimeCheckRecovered',
            'App\Services\OhDearWebhooks\EventSubscriber@onUptimeCheckRecovered'
        );
    }

    public function onUptimeCheckFailed(OhDearWebhookCall $ohDearWebhookCall)
    {
        $site = $ohDearWebhookCall->site();

        event(new UptimeCheckFailed($site['id'], $site['url']));
    }

    public function onUptimeCheckRecovered(OhDearWebhookCall $ohDearWebhookCall)
    {
        $site = $ohDearWebhookCall->site();

        event(new UptimeCheckRecovered($site['id'], $site['url']));
    }
}
You can see that when even an Oh Dear! event comes in (such as ohdear-webhooks::uptimeCheckFailed) were are going to fire off an new event of our own (for instance UptimeCheckFailed). Our own events extend DashboardEvent which means they will be broadcasted via Pusher to the browser.
This is the code of the Uptime Vue component that receives the events at the client side.
<template>
    <tile v-if="hasFailingUrls" :position="position" modifiers="overflow yellow above">
        <section class="uptime">
            <h1 class="uptime__title">Downtime</h1>
            <ul class="uptime__notifications">
                <li v-for="failing in failingUrls" class="uptime__notification">
                    <h2 class="uptime__notification__title h-ellipsis">{{ failing.url }}</h2>
                </li>
            </ul>
        </section>
    </tile>
</template>
<script>
    import echo from '../mixins/echo';
    import Tile from './atoms/Tile';
    import { addClassModifiers, formatDuration } from '../helpers';

    export default {

        components: {
            Tile,
        },

        filters: {
            formatDuration,
        },

        mixins: [echo],

        props: ['position'],

        data() {
            return {
                failingUrls: [],
            };
        },

        computed: {
            hasFailingUrls() {
                return this.failingUrls.length > 0;
            },
        },

        methods: {
            addClassModifiers,

            getEventHandlers() {
                return {
                    'Uptime.UptimeCheckFailed': response => {
                        this.add(response.url);
                    },
                    'Uptime.UptimeCheckRecovered': response => {
                        this.remove(response.url);
                    },
                };
            },

            add(url) {
                this.failingUrls = this.failingUrls.filter(failingUrl => url !== failingUrl.url);

                this.failingUrls.push({ url });
            },

            remove(url) {
                this.failingUrls = this.failingUrls.filter(failingUrl => url !== failingUrl.url);
            },
        },
    };
</script>
This component will listen for incoming events (some setup work is done inside the echo Mixin). As soon as there is one failingUrl that the Uptime tile is being displayed. The above css class makes sure that the component is displayed over the Twitter component that is normally visible in the first column.
In closing
Integrating Oh Dear! webhooks in your applications isn't difficult at all. You'll find more info on the webhooks package in the Oh Dear! documention. Instead of using the webhooks, you could also opt to use the regular API or PHP SDK. The dashboard is entirely free, you'll find the source code in this repo on GitHub.