Visualising Laravel and Horizon metrics using Prometheus and Grafana original
I'm proud to announce that we've released a new package called spatie/laravel-prometheus. Using this package, you can send all sorts of metrics (user counts, subscription counts, queue workloads) around your Laravel to Prometheus and visualize the historical trends using Grafana.
Using the default instructions Prometheus and Grafana can be daunting to set up. That's why package documentation also has friendly, detailed instructions on how to get started with Prometheus and Grafana.
Let's dive in!
The benefits of visualizing metrics
Before diving into how you can use the package, let's first look at how visualizing metrics can help you understand what's happening in your app.
Here's a screenshot of a simple Laravel app that has four queues.
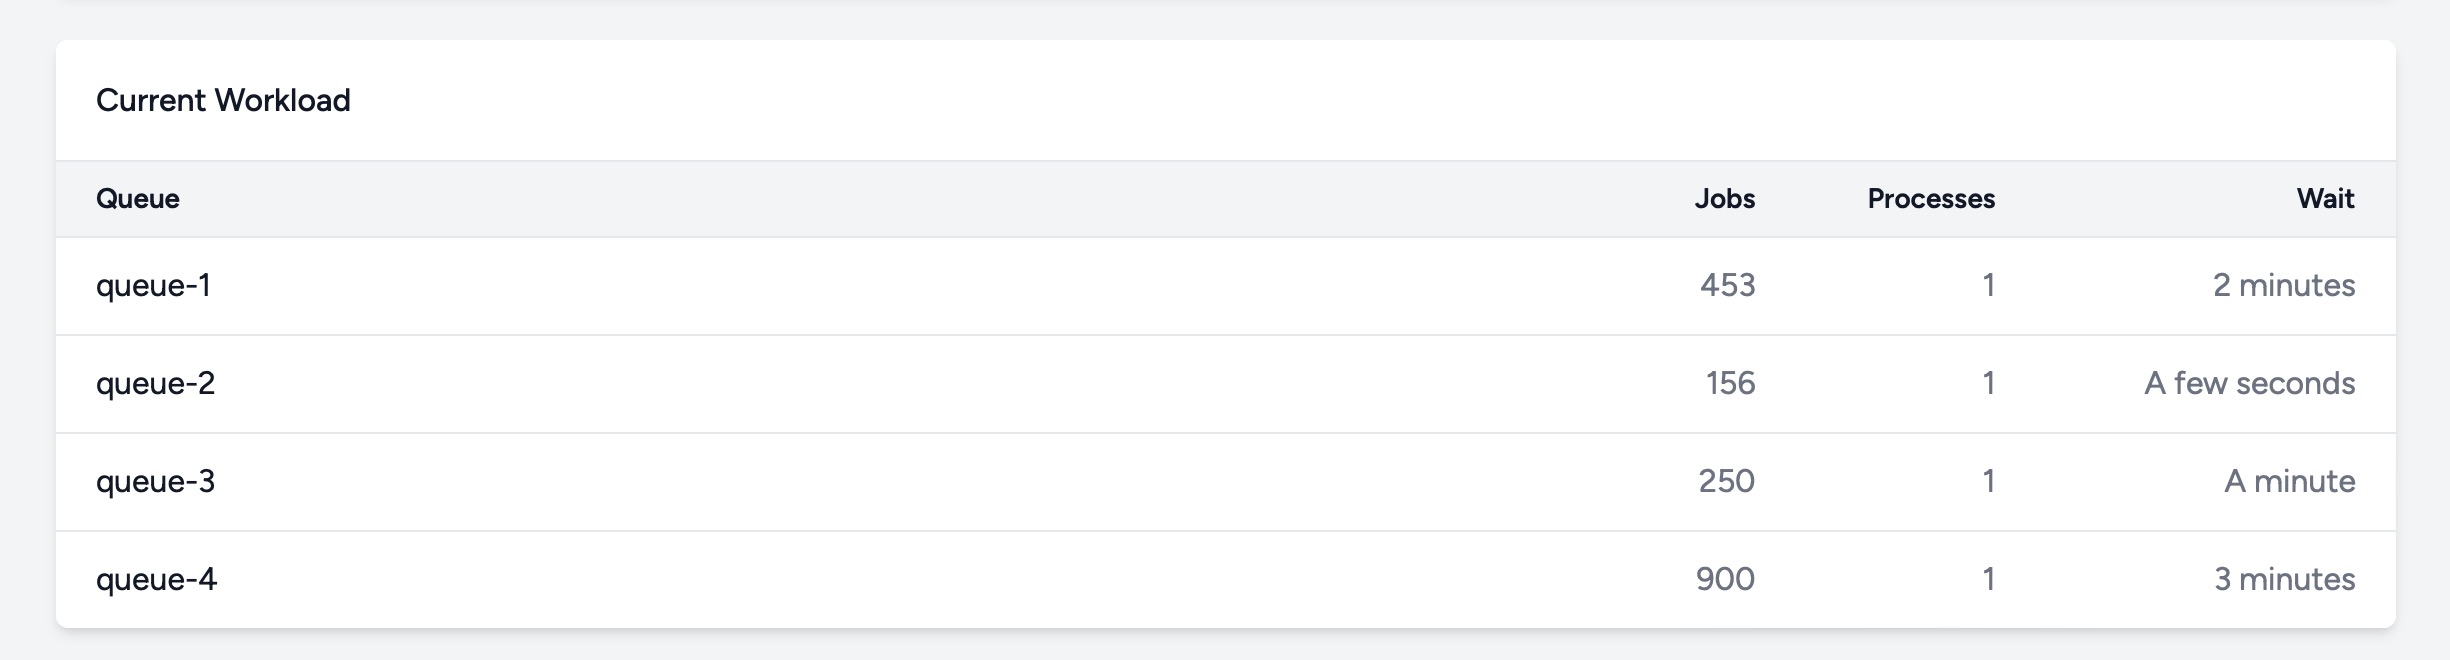
You can see that there are currently some jobs in all queues. Are these numbers healthy and normal for my application? To answer this question, more than simple point-in-time numbers are needed.
Oh Dear is a batteries-included monitoring service I've built. Under the hood, we use Laravel Horizon to power the queues. We use our spatie/laravel-prometheus package to export the workload of the queues to Prometheus and plot a graph of that data using Grafana.
Here's a graph of the workload of our queue for the past 30 minutes. To give too much away about our operations. I've removed the actual job counts on the left side of the graph and the legend with queue names under the graph.
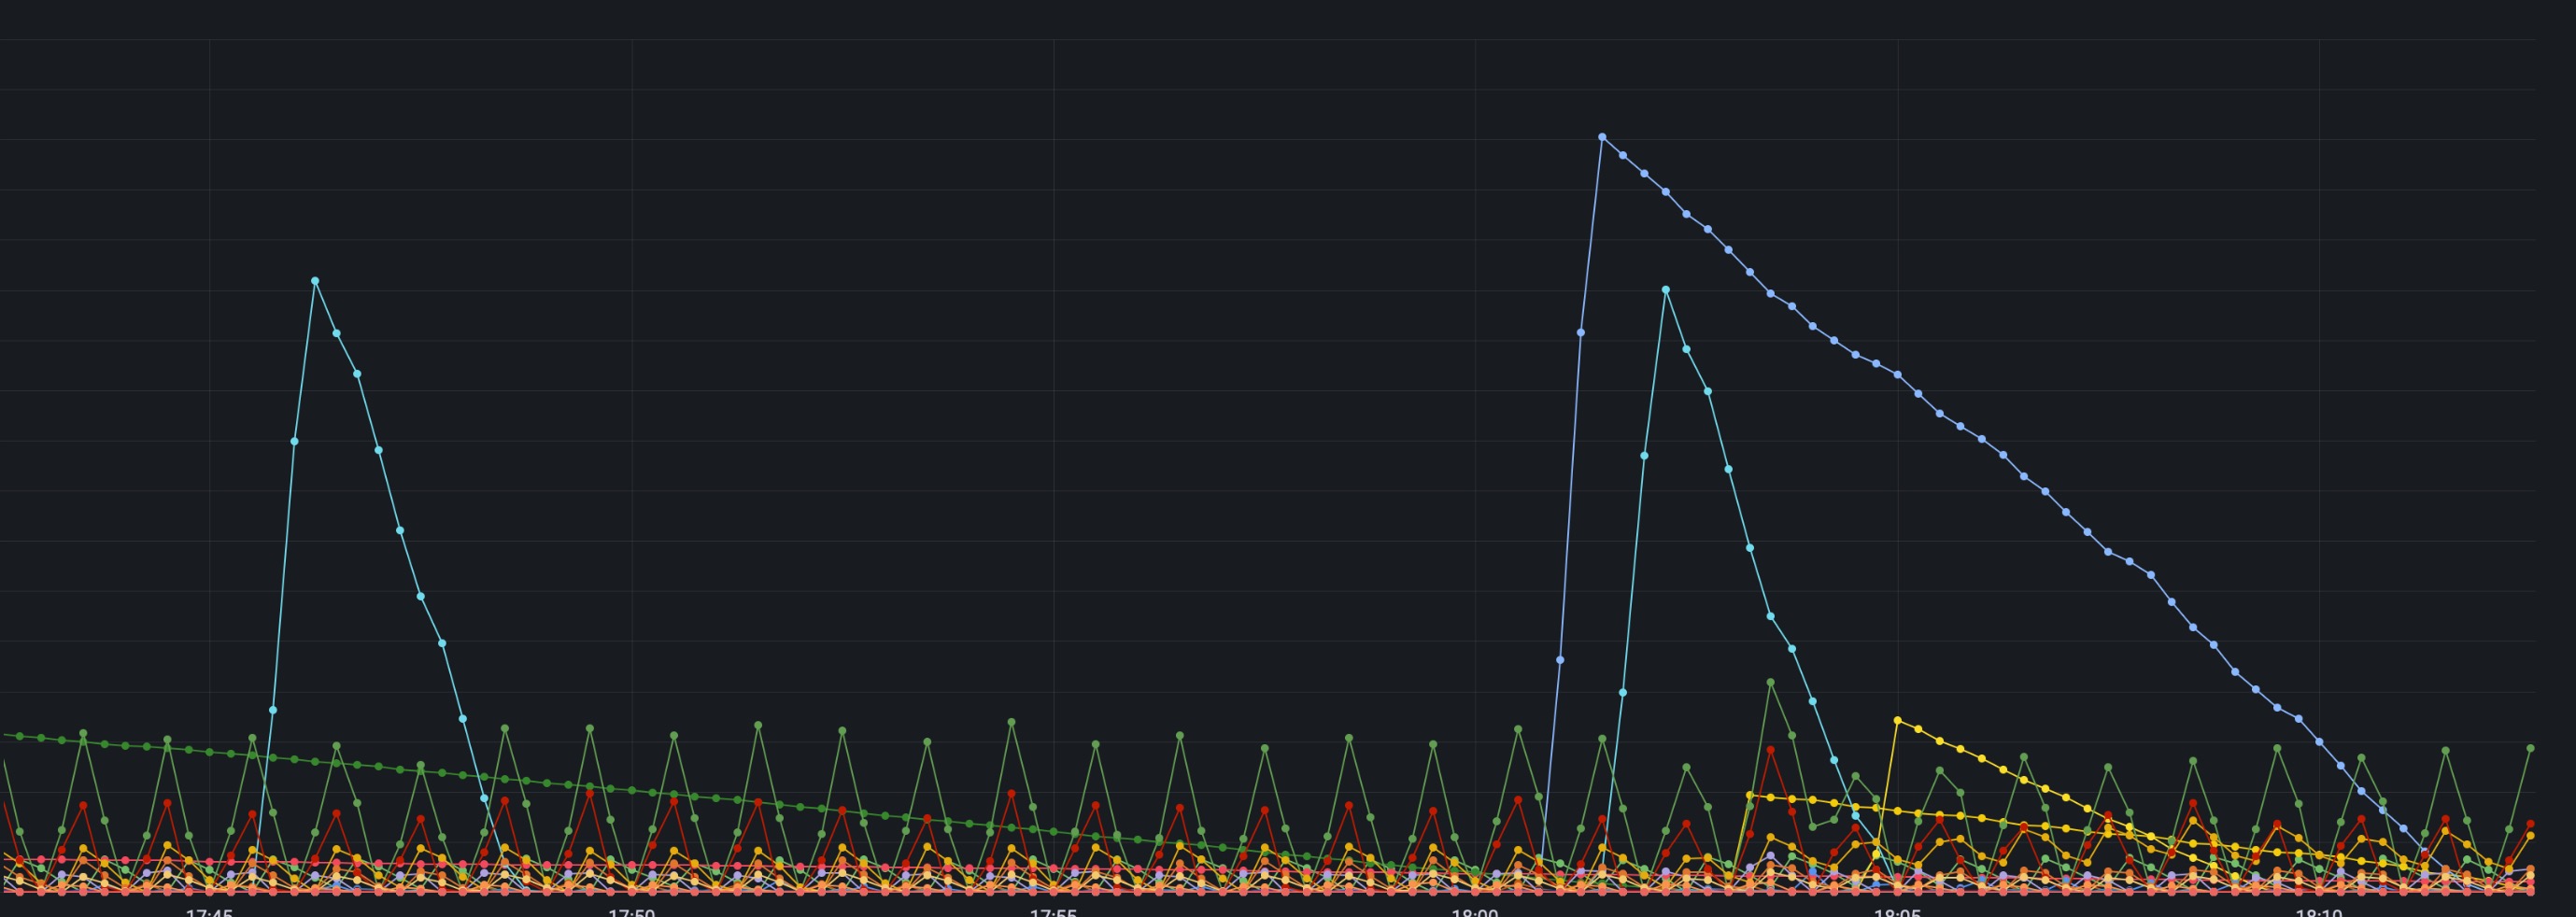
In the screenshot, every colored line is the workload of a queue. You can see that our queues have a certain "rhythm." Poetically said this is a visualization of our queues' heartbeat or breathing rhythm.
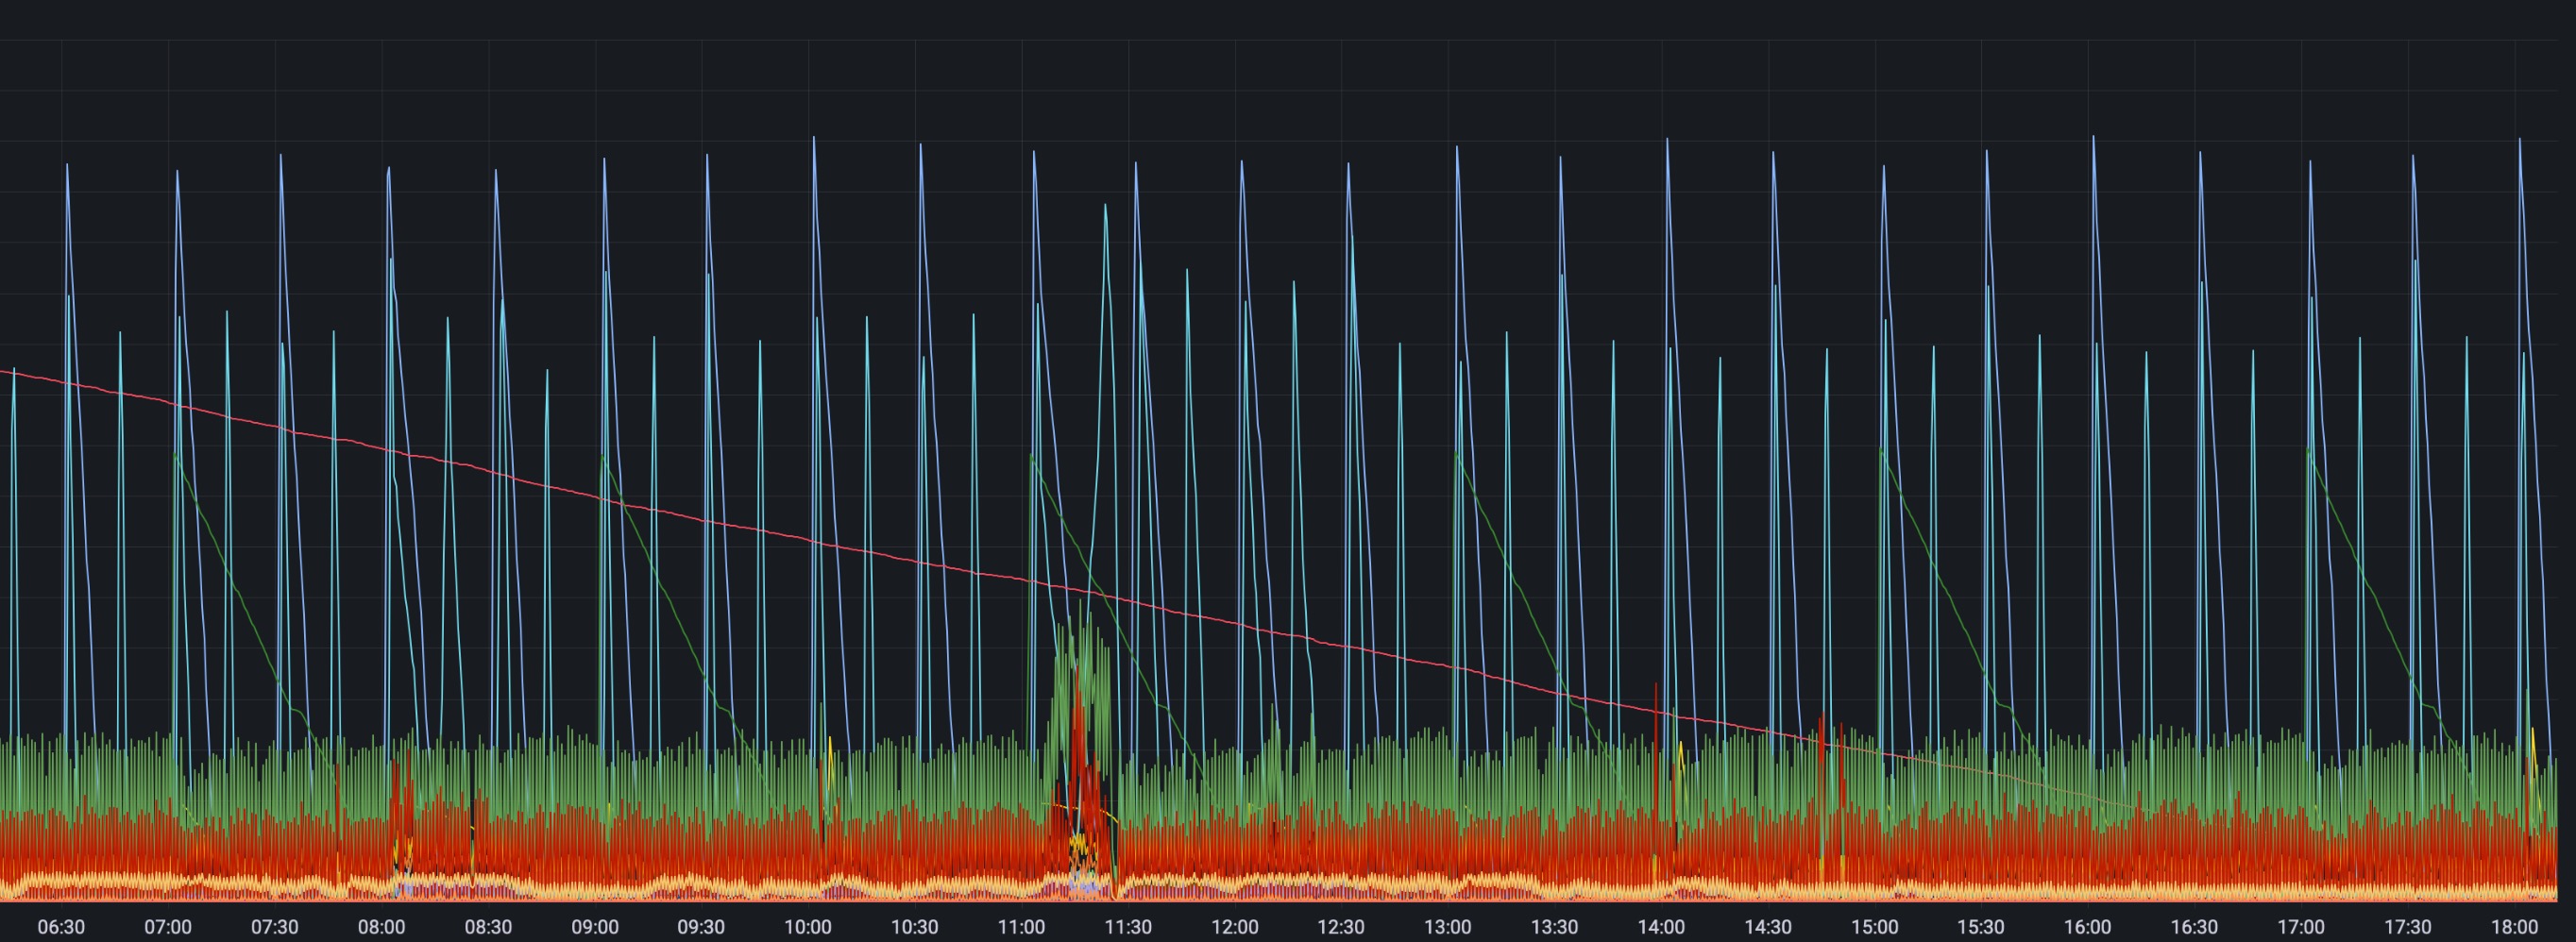
A visualization like this makes it easy to see if something weird is or is happening. Here's a screenshot of our queues, but this time for the past 12 hours. You can see that something was off around 11 am.
Let's also take a look at a scale of 7 days. In this screenshot, you can again see the breathing rhythm of our queues.
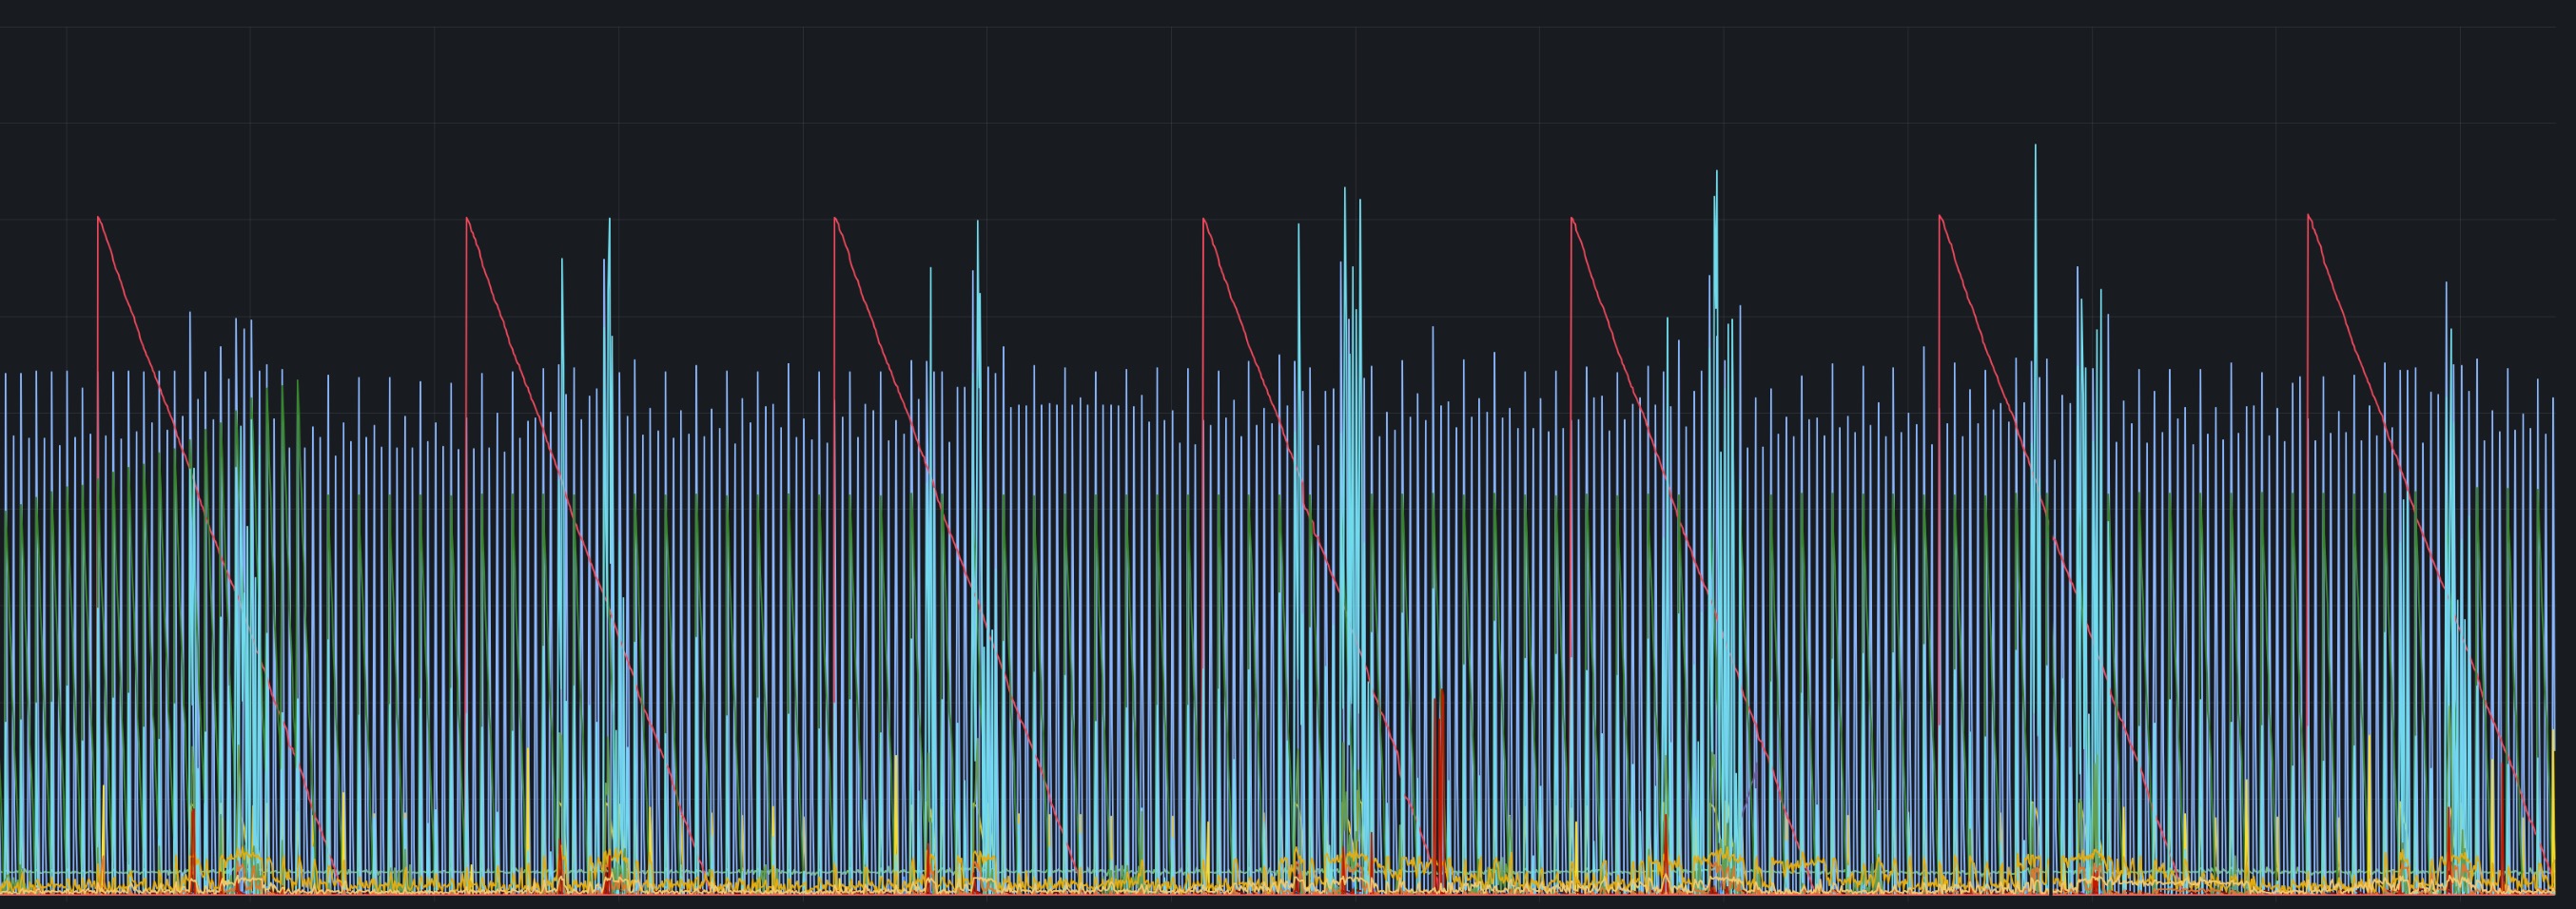
Plotting out the historical load on Horizon gives us a good picture of the health of the queues. Of course, these graphs aren't everything. You still need a monitoring solution like Flare to detect any exceptions that happen inside the jobs.
In the example above, we only plotted technical data (the workload of queues), but seeing trends in business-y data (the number of users, subscriptions in your SaaS, ...) can be very helpful in making business decisions.
Using Laravel Prometheus in your Laravel app
Let's install Laravel Prometheus in your app. This can be done with Composer. No surprises there!
composer require spatie/laravel-prometheus
Next up, we can complete the installation with this artisan command.
php artisan prometheus:install
This command will copy and register this service provider in app/Providers/PrometheusServiceProvider.php
namespace App\Providers;

use Illuminate\Support\ServiceProvider;
use Spatie\Prometheus\Collectors\Horizon\CurrentMasterSupervisorCollector;
use Spatie\Prometheus\Collectors\Horizon\CurrentProcessesPerQueueCollector;
use Spatie\Prometheus\Collectors\Horizon\CurrentWorkloadCollector;
use Spatie\Prometheus\Collectors\Horizon\FailedJobsPerHourCollector;
use Spatie\Prometheus\Collectors\Horizon\HorizonStatusCollector;
use Spatie\Prometheus\Collectors\Horizon\JobsPerMinuteCollector;
use Spatie\Prometheus\Collectors\Horizon\RecentJobsCollector;
use Spatie\Prometheus\Facades\Prometheus;

class PrometheusServiceProvider extends ServiceProvider
{
    public function register()
    {
        /*
         * Here, you can register all the exporters that you
         * want to export to Prometheus
         */
        Prometheus::addGauge('my_gauge', function () {
            return 123.45;
        });

        /*
         * Uncomment this line if you want to export
         * All Horizon metrics to Prometheus
         */
        // $this->registerHorizonCollectors();
    }

    public function registerHorizonCollectors(): self
    {
        Prometheus::registerCollectorClasses([
            CurrentMasterSupervisorCollector::class,
            CurrentProcessesPerQueueCollector::class,
            CurrentWorkloadCollector::class,
            FailedJobsPerHourCollector::class,
            HorizonStatusCollector::class,
            JobsPerMinuteCollector::class,
            RecentJobsCollector::class,
        ]);

        return $this;
    }
}
Using the Prometheus facade, values can be registered to be exported to Prometheus. In the code above, you can see that call addGauge to the facade. A "gauge" is one of the available metric types in Prometheus: it's a value that can both go up and down.
Defining your own metrics
The code above is meant as a generic example. If you want to export your user count to Prometheus, you'll add code like this.
use App\Models\User;
use Spatie\Prometheus\Facades\Prometheus;

Prometheus::addGauge('user_count', function () {
    return User::count();
});
There are many more options to define gauges (you can define help texts, labels, ...) Learn more about all these options in our docs.
How will this data be transported to Prometheus? Well, the package adds an endpoint /prometheus to your app, where all registered gauges and values will be rendered in a format that Prometheus understands.
Here's what such output could look like.
# HELP demo_app_user_count
# TYPE demo_app_user_count gauge
demo_app_user_count 5424
You can configure Prometheus to scrape that /prometheus endpoint periodically, or you could use the Grafana agent to push this information to Prometheus/Grafana (I'll talk more about setting this up in the next chapter of this blog post).
Exporting Horizon metrics
In addition to defining your own metrics, you can also use the package to export all metrics around Horizon, such as the number of jobs waiting in every queue, how many processes there are per queue, and much more.
The package comes with built-in support for exporting Horizon metrics. The only thing you need to do is to uncomment the registerHorizonCollectors line in the PrometheusServiceProvider.
class PrometheusServiceProvider extends ServiceProvider
{
    public function register()
    {
        // define other metrics here...

        $this->registerHorizonCollectors();
    }

    public function registerHorizonCollectors(): self
    {
        Prometheus::registerCollectorClasses([
            CurrentMasterSupervisorCollector::class,
            CurrentProcessesPerQueueCollector::class,
            CurrentWorkloadCollector::class,
            FailedJobsPerHourCollector::class,
            HorizonStatusCollector::class,
            JobsPerMinuteCollector::class,
            RecentJobsCollector::class,
        ]);

        return $this;
    }
}
When we now look at the output on the /prometheus endpoint, you'll see an output like this. For this example, I've defined four queues on Horizon and dispatched a couple of jobs.
# HELP demo_app_horizon_current_processes Current processes of all queues
# TYPE demo_app_horizon_current_processes gauge
demo_app_horizon_current_processes{queue="queue-1"} 1
demo_app_horizon_current_processes{queue="queue-2"} 1
demo_app_horizon_current_processes{queue="queue-3"} 1
demo_app_horizon_current_processes{queue="queue-4"} 1
# HELP demo_app_horizon_current_workload Current workload of all queues
# TYPE demo_app_horizon_current_workload gauge
demo_app_horizon_current_workload{queue="queue-1"} 494
demo_app_horizon_current_workload{queue="queue-2"} 197
demo_app_horizon_current_workload{queue="queue-3"} 291
demo_app_horizon_current_workload{queue="queue-4"} 949
# HELP demo_app_horizon_failed_jobs_per_hour The number of recently failed jobs
# TYPE demo_app_horizon_failed_jobs_per_hour gauge
demo_app_horizon_failed_jobs_per_hour 0
# HELP demo_app_horizon_jobs_per_minute The number of jobs per minute
# TYPE demo_app_horizon_jobs_per_minute gauge
demo_app_horizon_jobs_per_minute 3
# HELP demo_app_horizon_master_supervisors The number of master supervisors
# TYPE demo_app_horizon_master_supervisors gauge
demo_app_horizon_master_supervisors 1
# HELP demo_app_horizon_recent_jobs The number of recent jobs
# TYPE demo_app_horizon_recent_jobs gauge
demo_app_horizon_recent_jobs 3908
# HELP demo_app_horizon_status The status of Horizon, -1 = inactive, 0 = paused, 1 = running
# TYPE demo_app_horizon_status gauge
demo_app_horizon_status 1
# HELP demo_app_user_count
# TYPE demo_app_user_count gauge
demo_app_user_count 5424
Visualizing metrics via Grafana.com
There are multiple ways to set up Prometheus and Grafana. You could install both pieces of software on your server and do some configuration to make it all work. The steps for this are outlined in our docs.
The easiest way to get started using Prometheus and visualizing data via Grafana is by creating a free account on grafana.com and using the hosted Grafana instance.
During this process, you'll install the Grafana agent, which will read the metrics on your /prometheus endpoint, and push them to Grafana.com.
I've prepared a little demo application that you could use to follow along with this part of the post. The demo application is a vanilla Laravel app, but with Laravel Prometheus and Horizon preinstalled and a command to dispatch some jobs on the four horizon queues.
Configuring Grafana
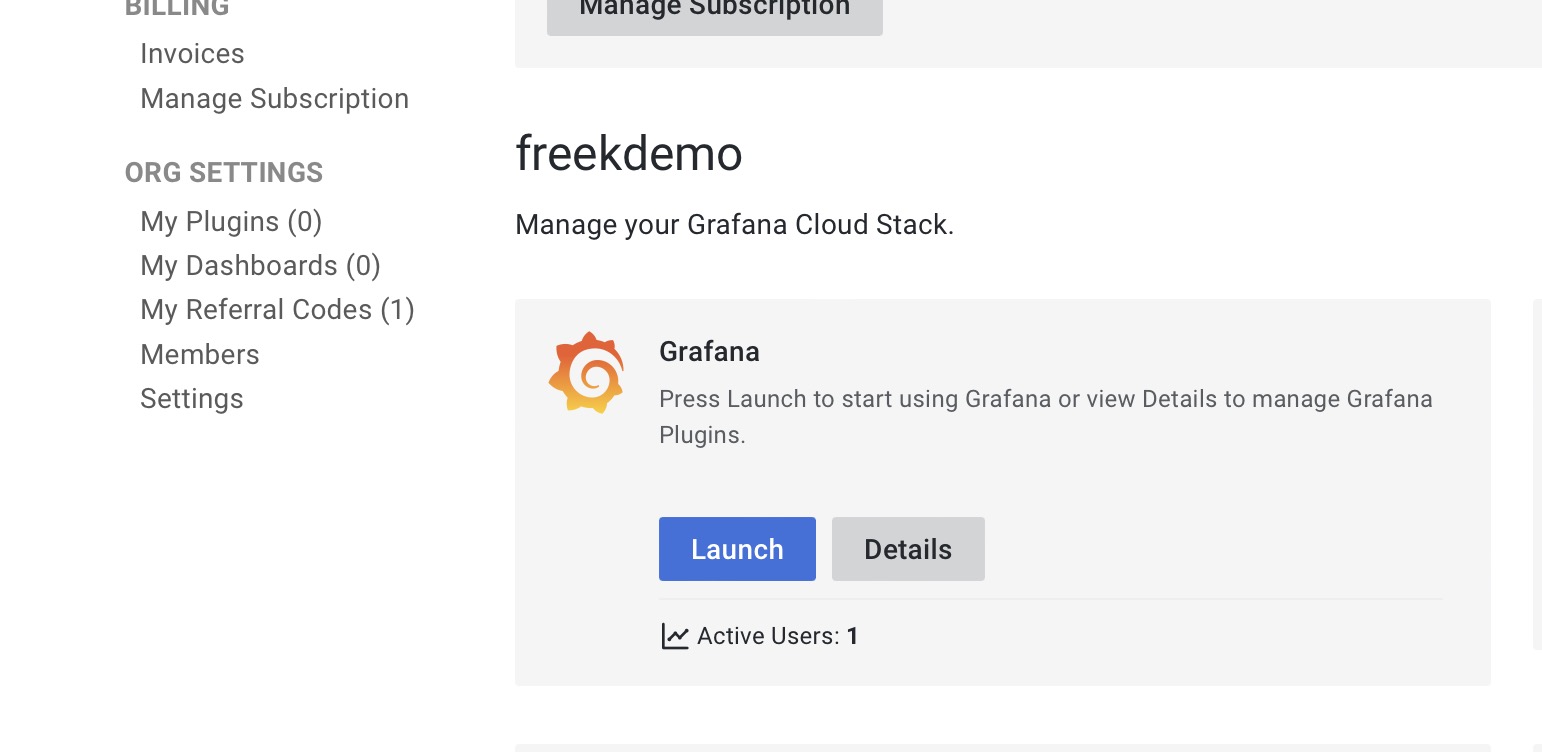
First, you must create a free account on Grafana.com. Once your account has been created, you'll be on your account dashboard. There, you should launch your Grafana instance by clicking the "Launch" button.
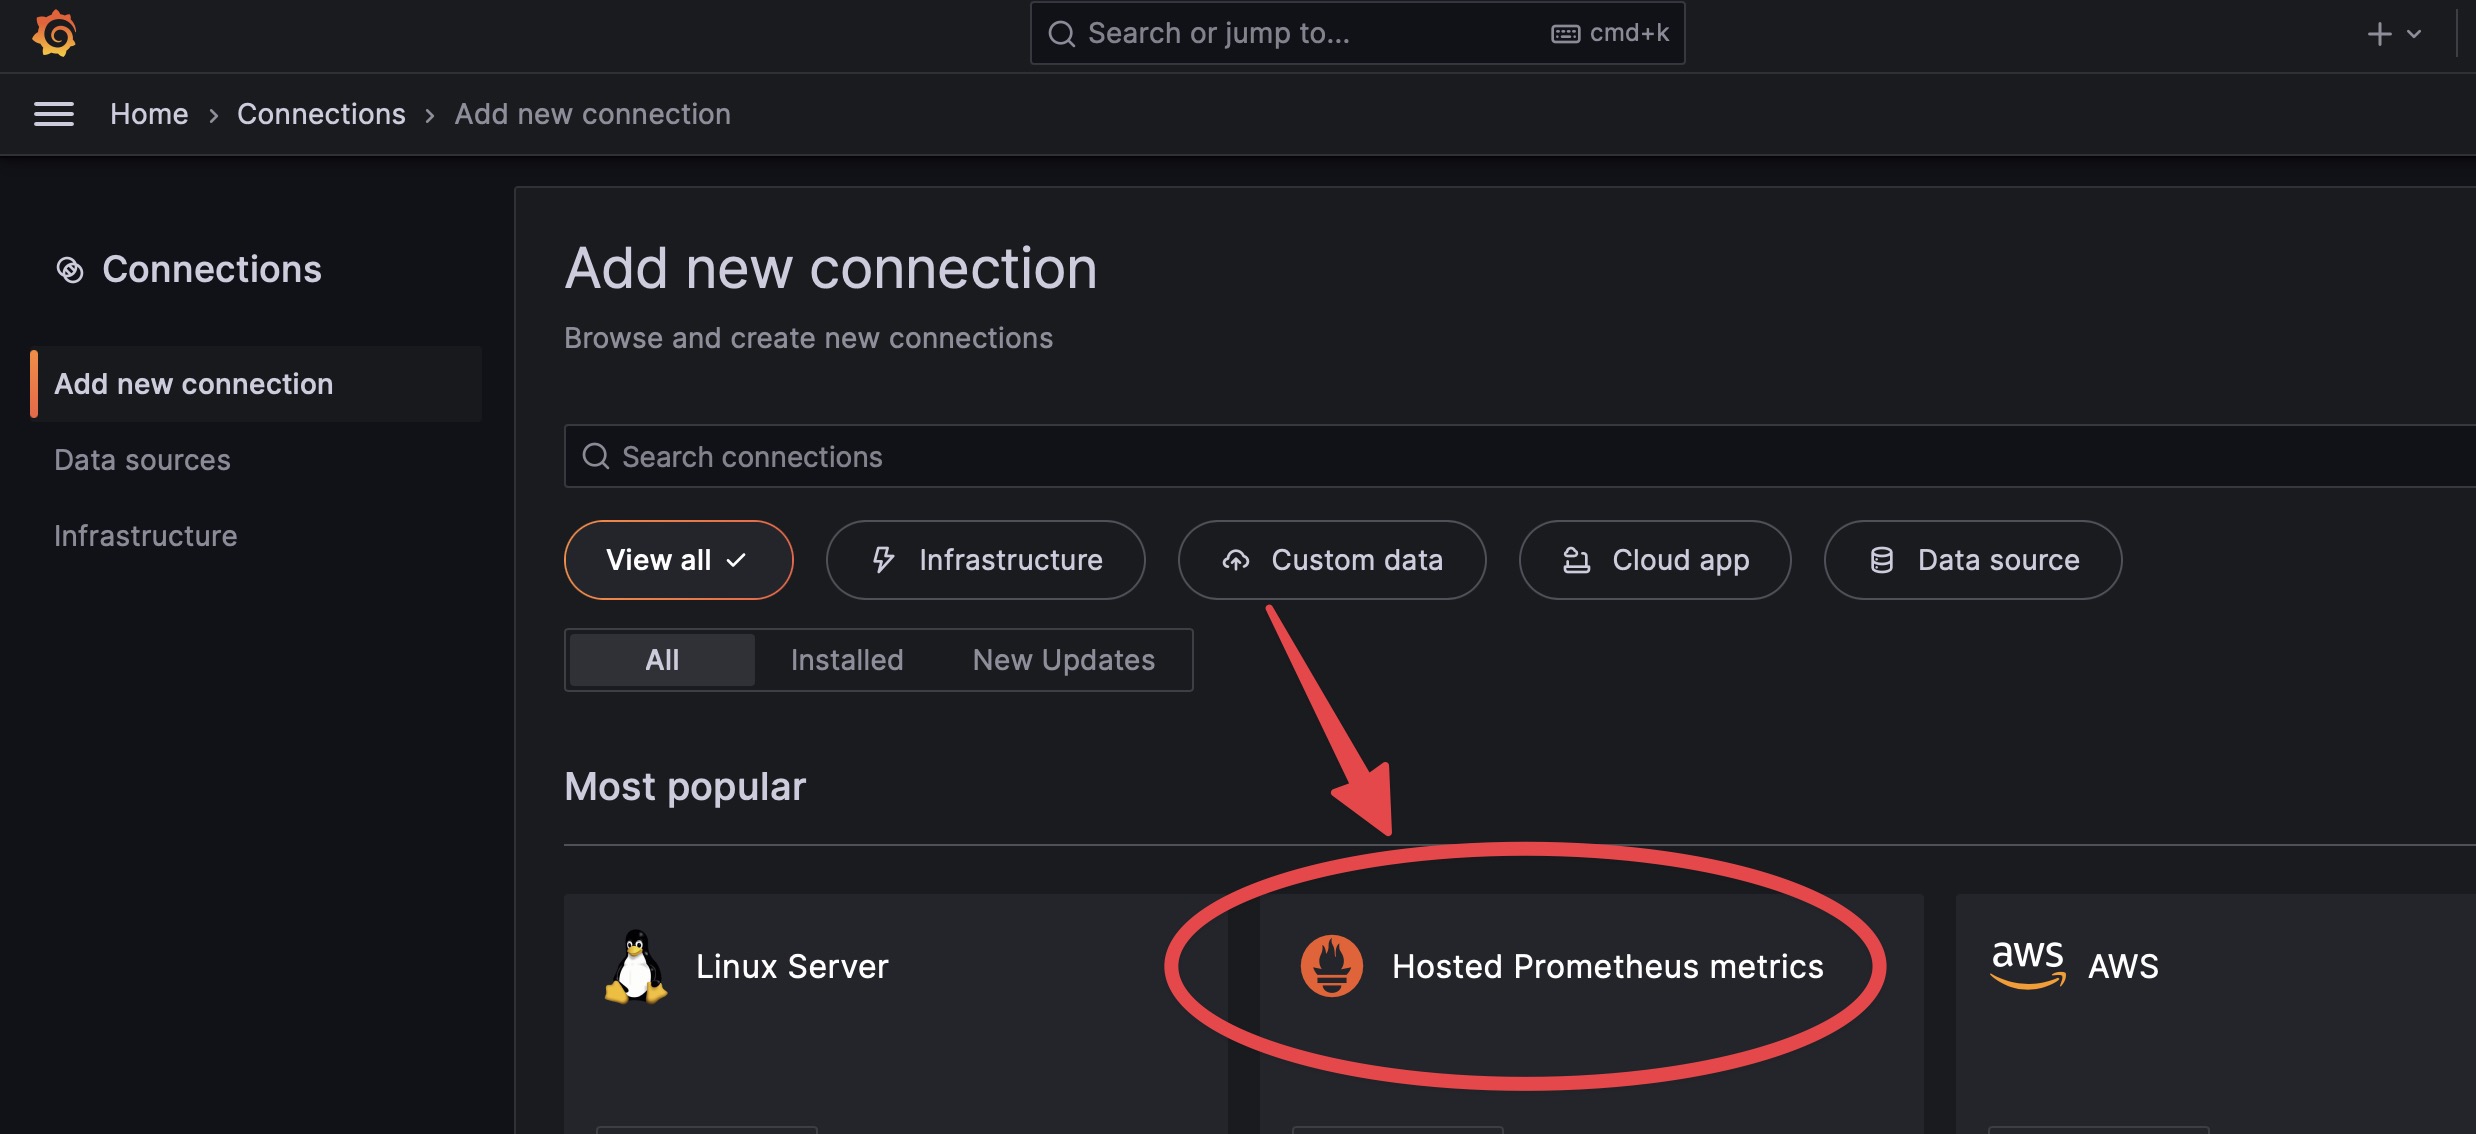
At this point, you'll be redirected to your Grafana instance. There, you must go to "Connections" and add a new connection of type "Hosted Prometheus Metrics."
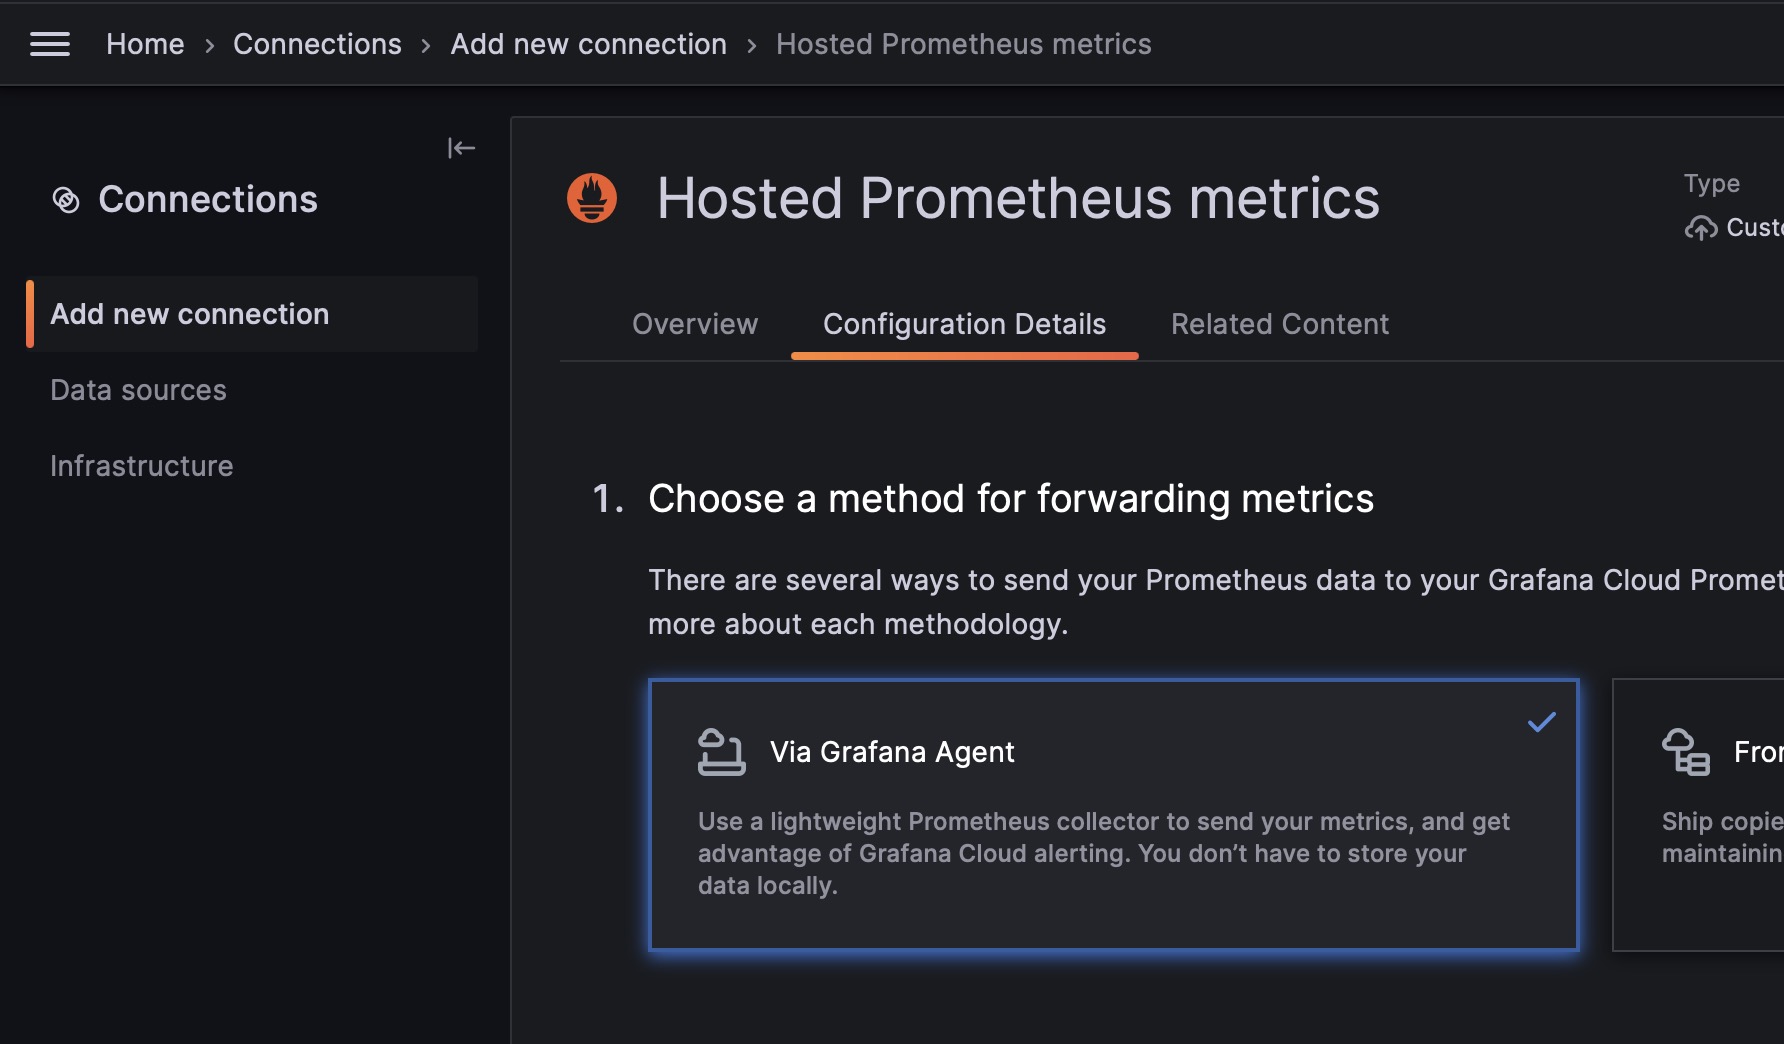
When creating a new connection, choose "Via Grafana Agent."
Next, follow the wizard, install the agent, and create a new config.
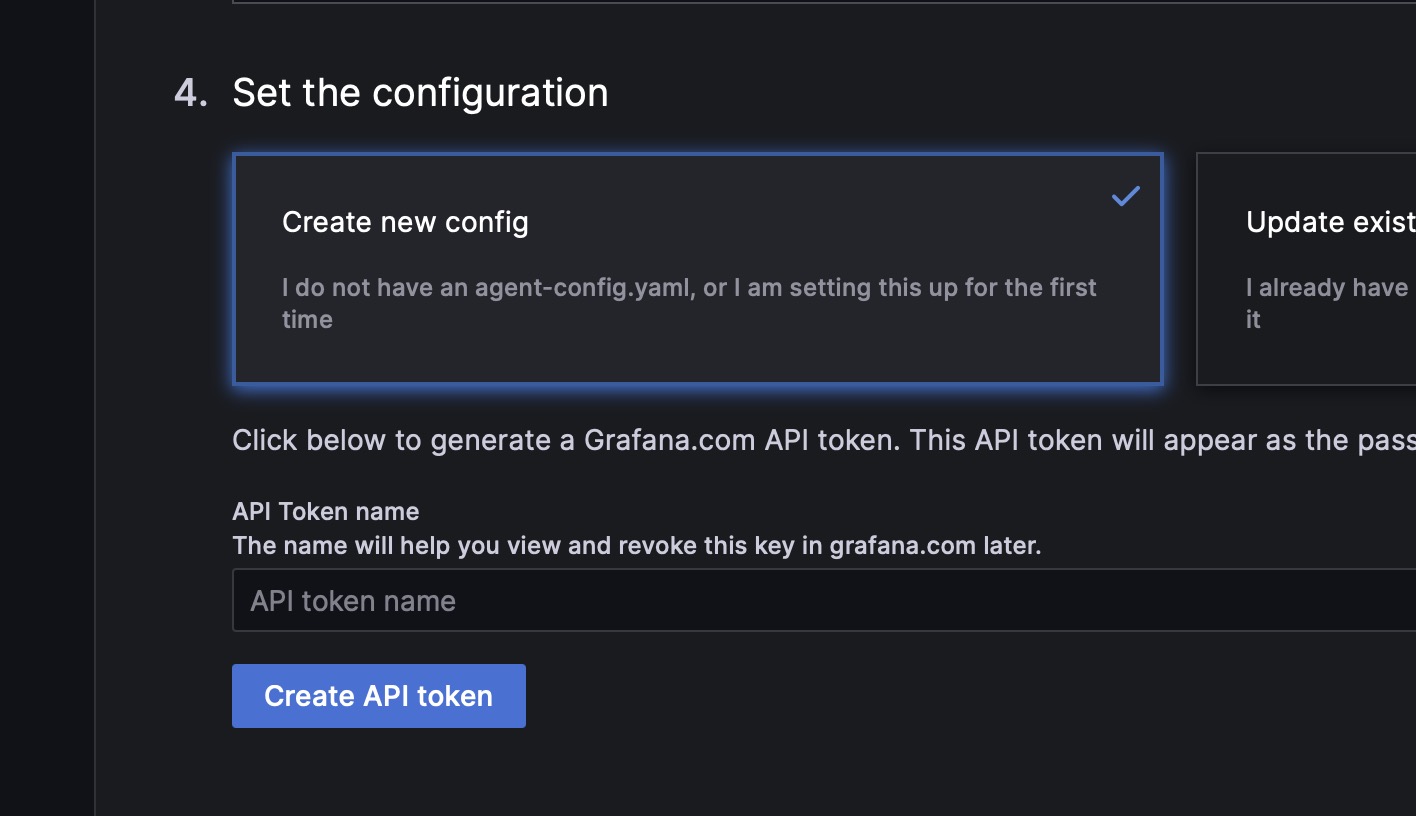
Follow the steps to create the config file and start the agent on your server. To keep the agent running, you might use something like Supervisord (Laravel Forge users can create a deamon)
In the scrape_configs key of the config, you should add a job to scrape the /prometheus endpoint of your Laravel application. For example:
  global:
      scrape_interval: 10s
  configs:
      - name: hosted-Prometheus
        scrape_configs:
            - job_name: laravel
              scrape_interval: 10s
              metrics_path: /prometheus
              static_configs:
                  - targets: ['your-app.com']
        remote_write:
            - url: <filled in by the wizard>
              basic_auth:
                  username: <filled in by the wizard>
                  password: <filled in by the wizard>
Of course, you should replace your-app.com with the domain of your application.
Creating a dashboard
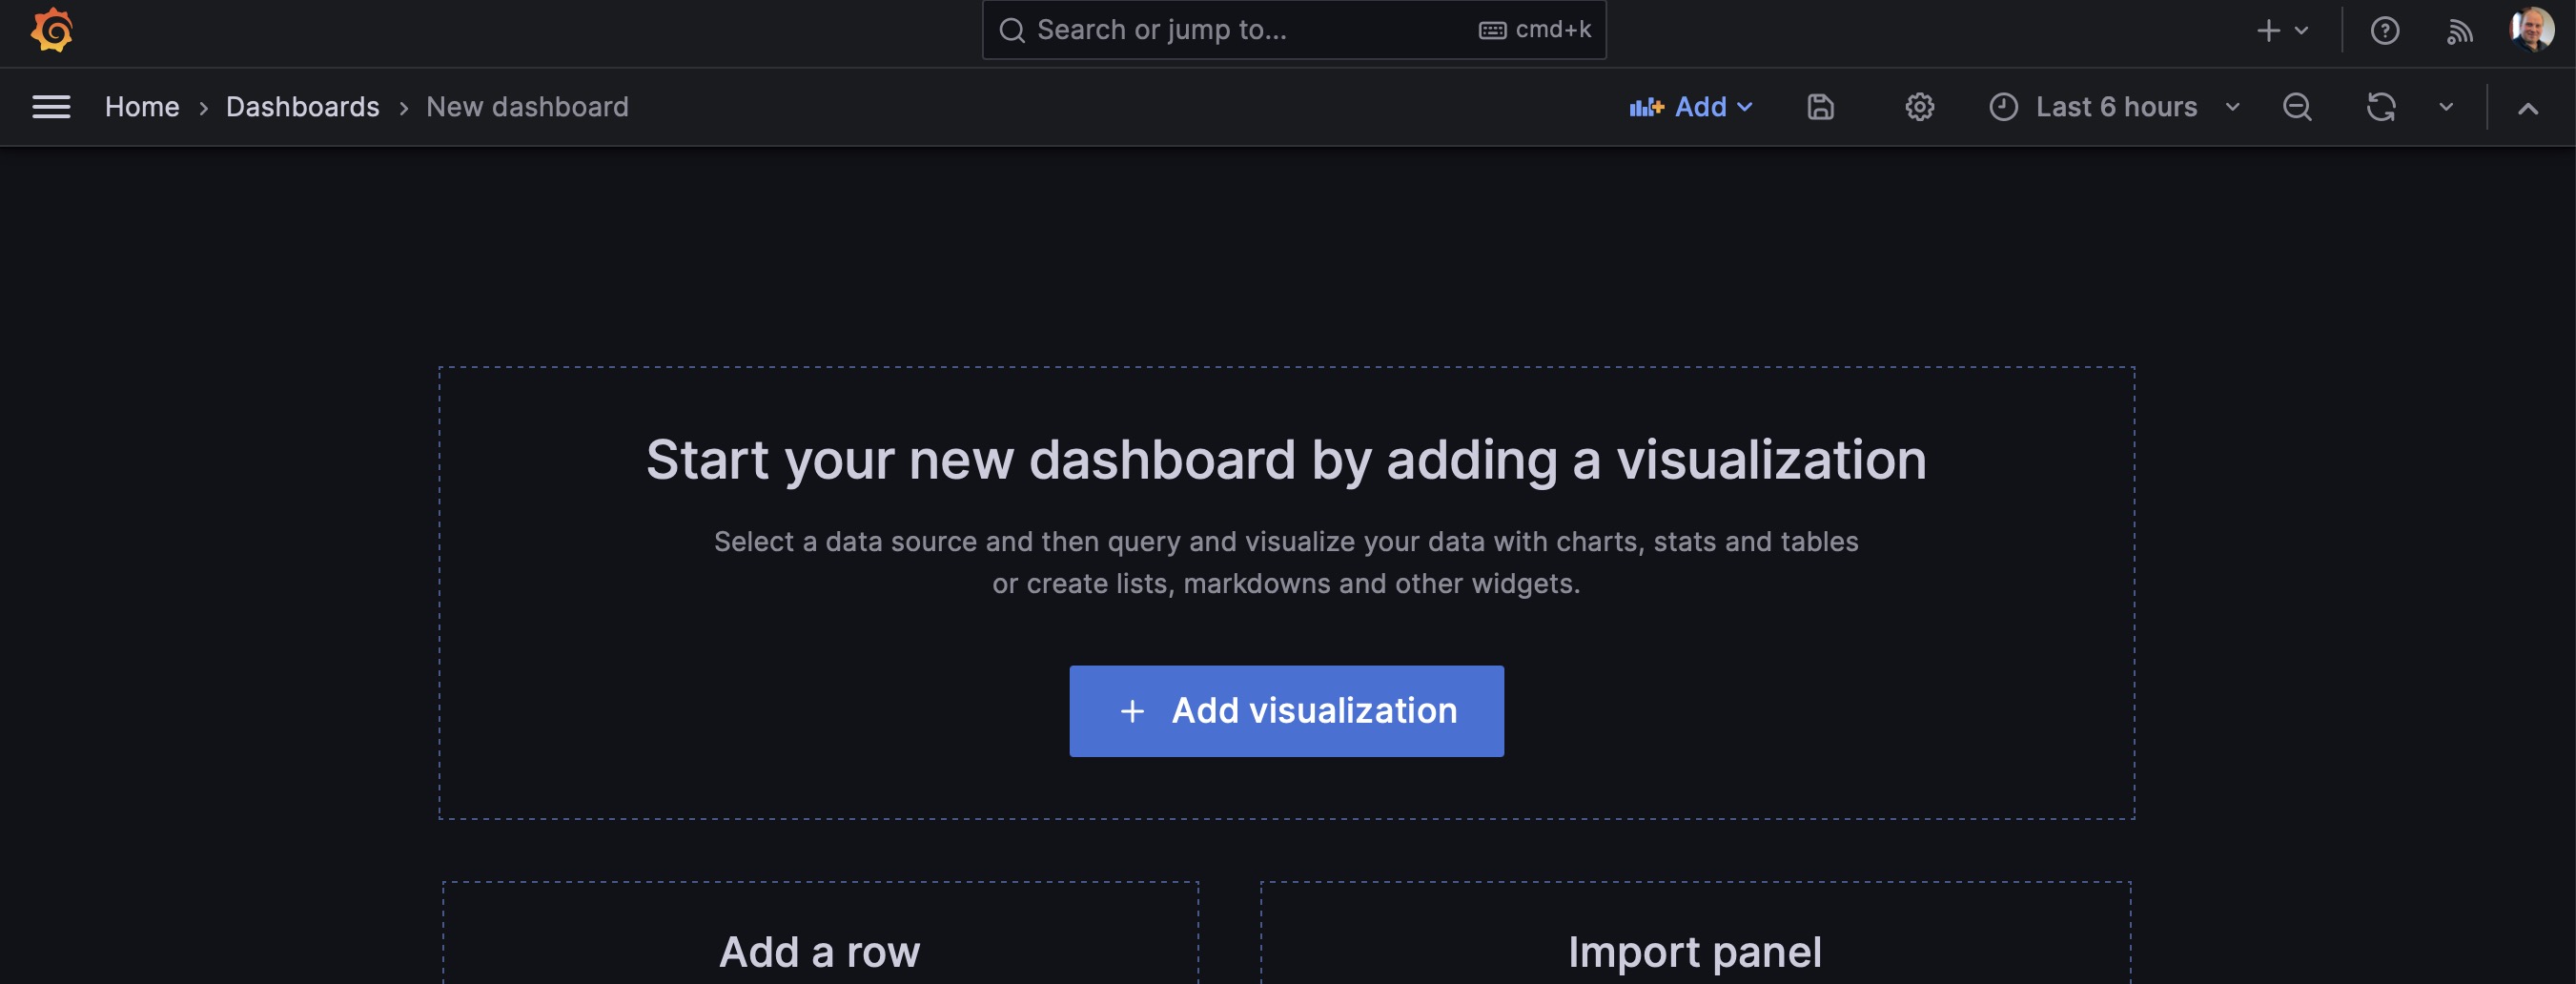
Once you've configured the agent, you can create a new dashboard. Head over to "Dashboards" and create a new dashboard.
On that screen, click "+ Add Visualization."
Next, click your hosted Prometheus instance as the source.
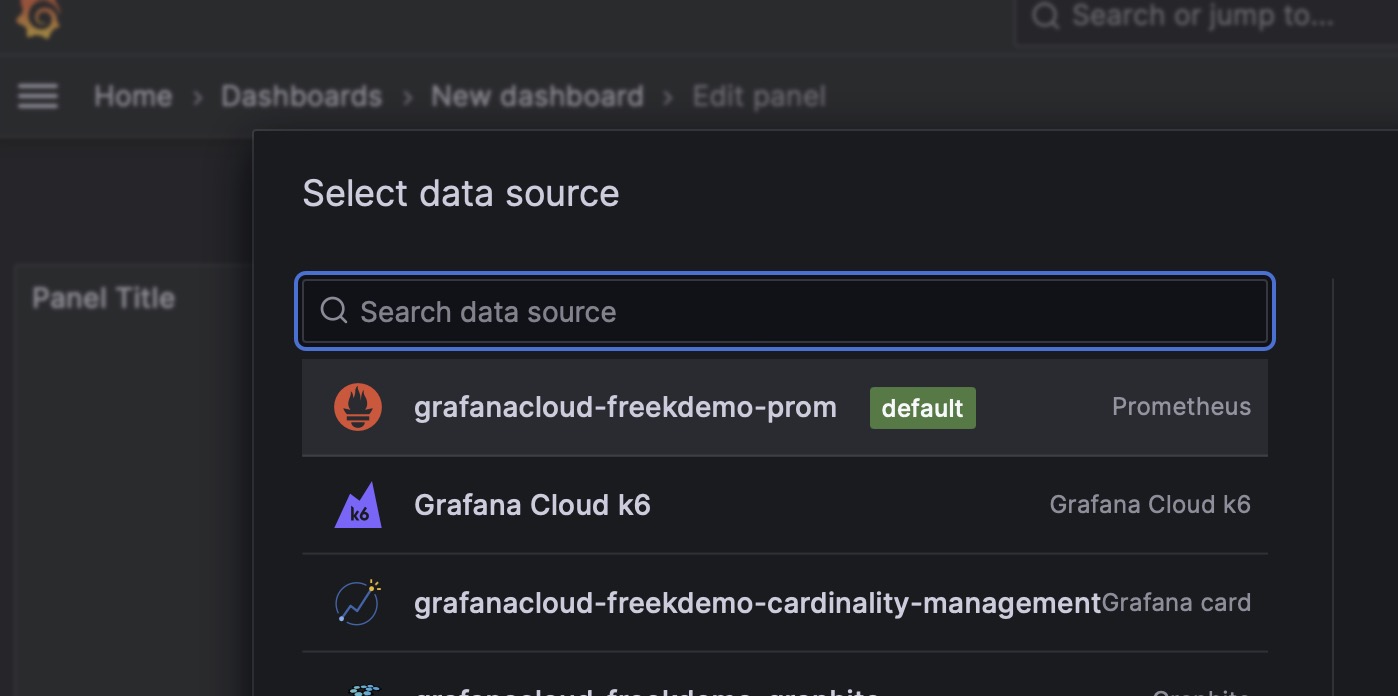
You should see all metrics being scraped from your Laravel application in the metric dropdown.
Let's pick the horizon's current workload; ensure that we're adding a tile of type "Type series," and optionally, you can add a title.
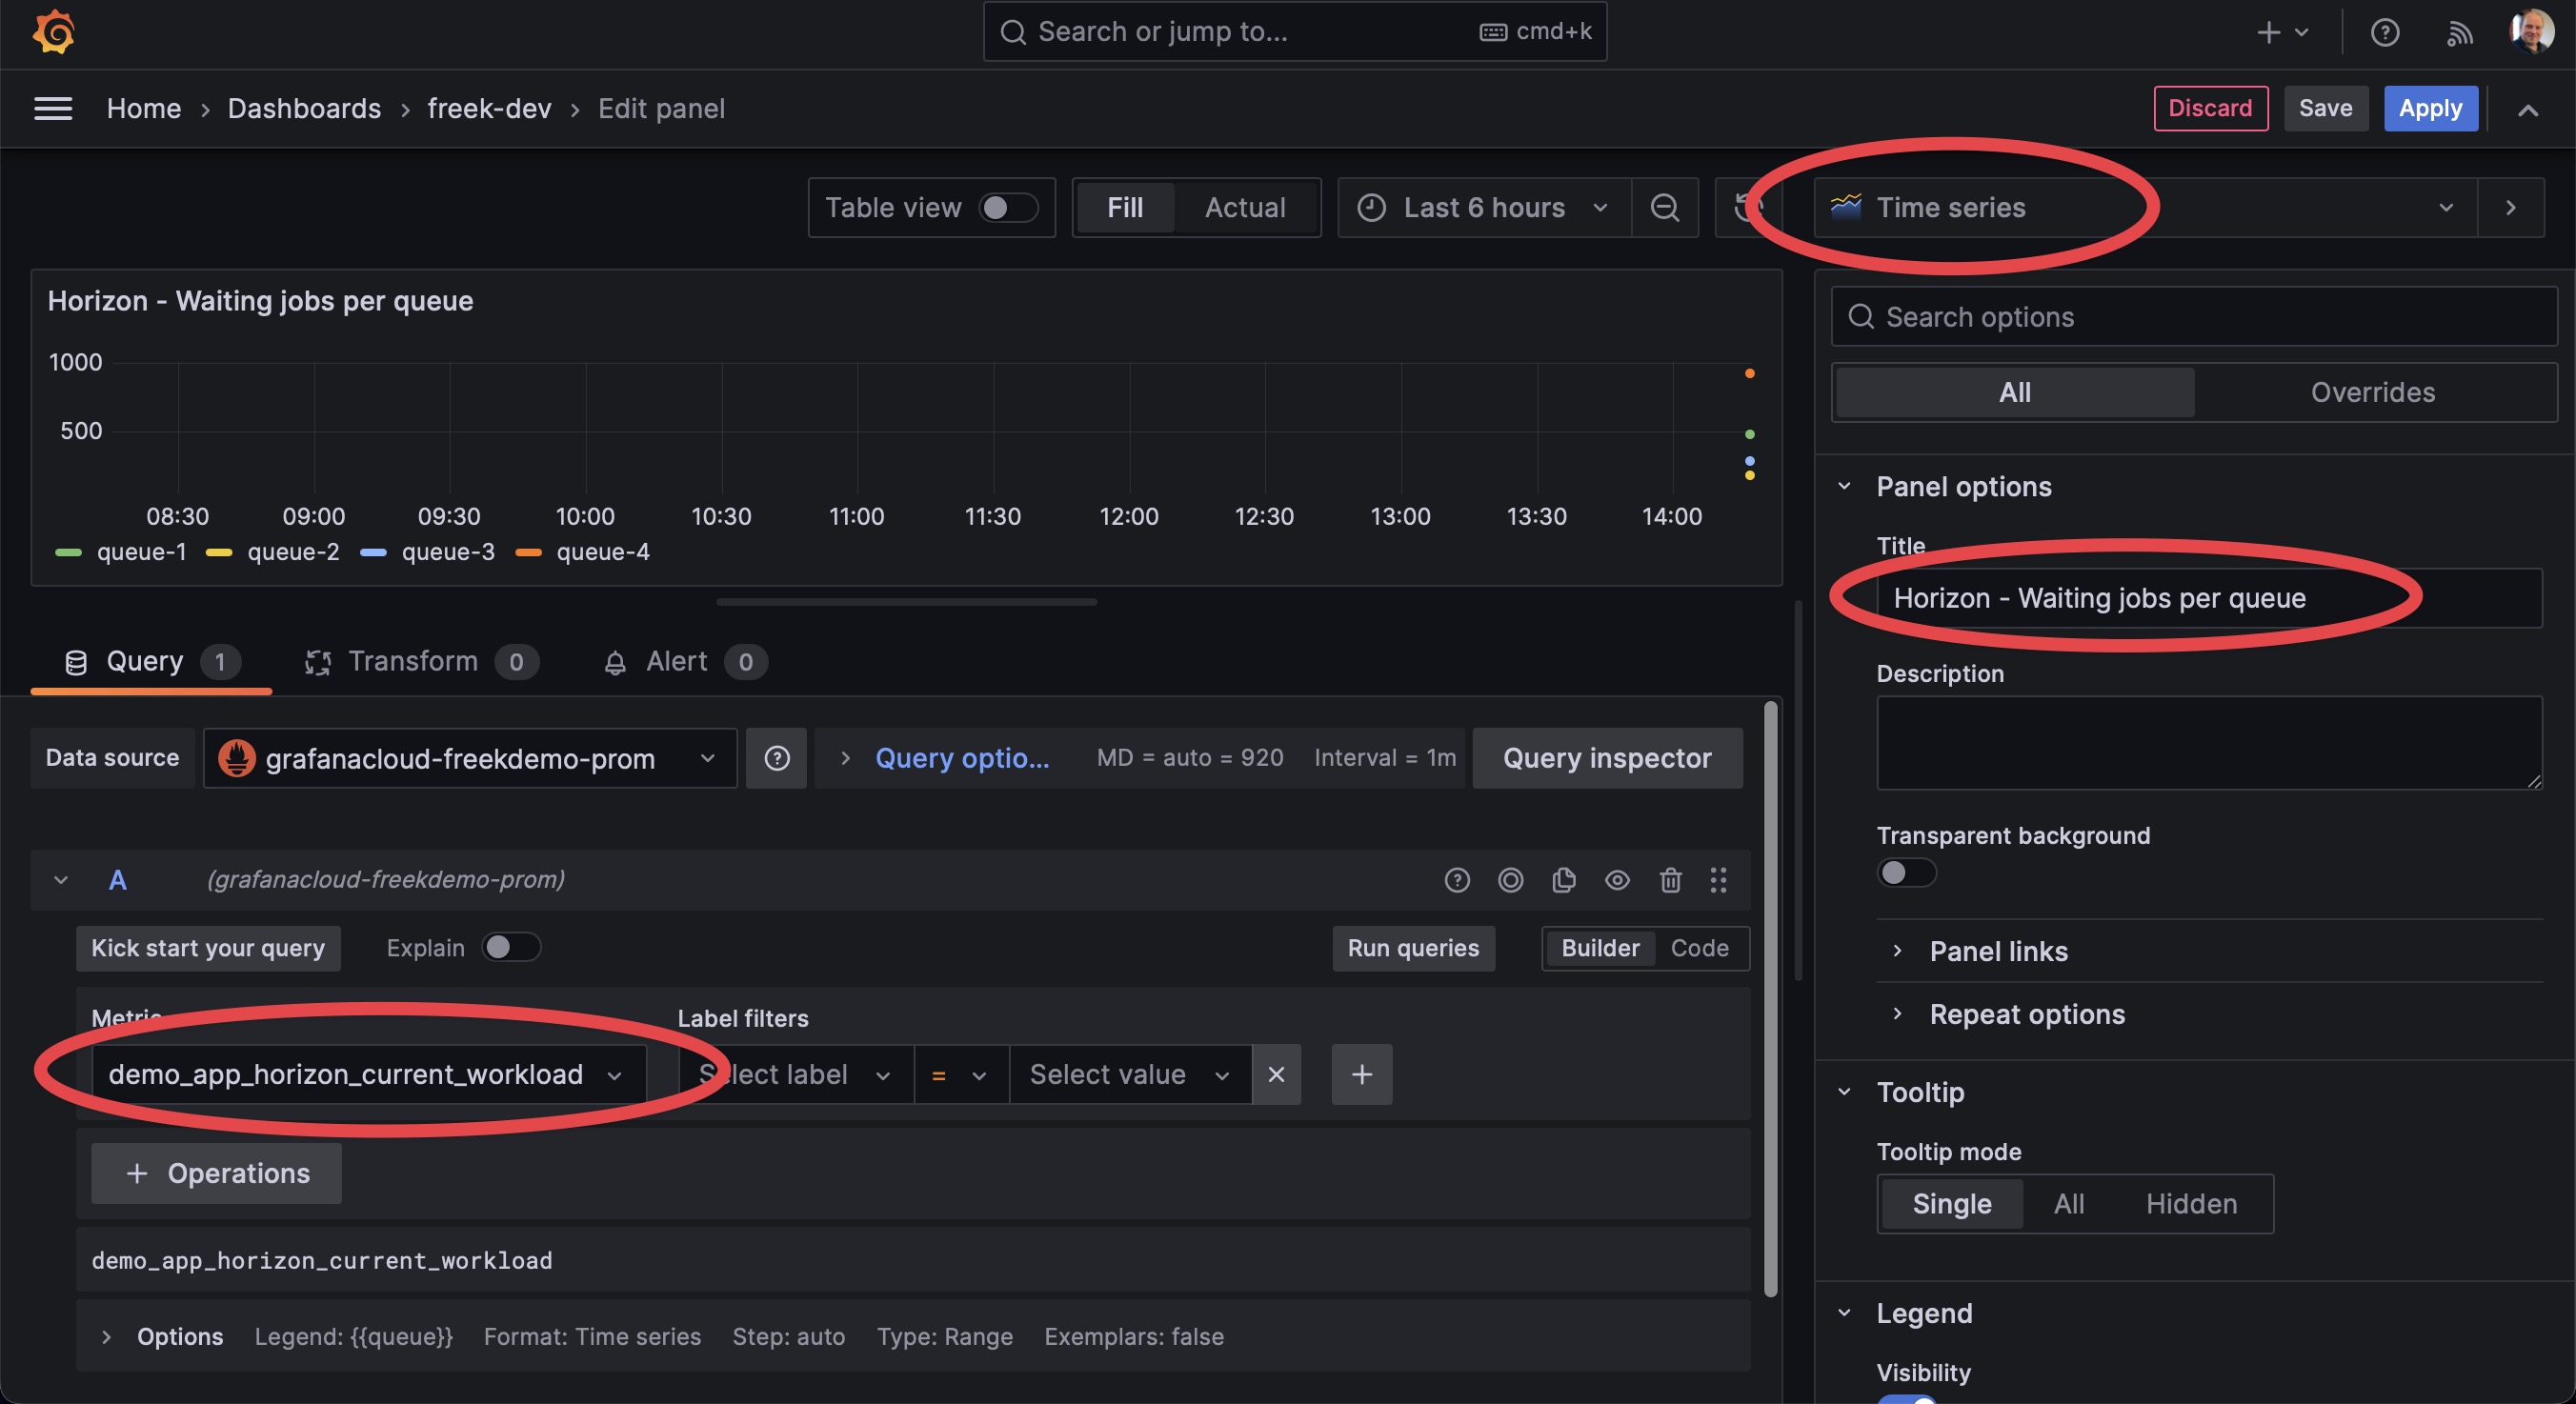
Also, to format the legend that will appear on the graph better, use {{queue}} to format the legend.
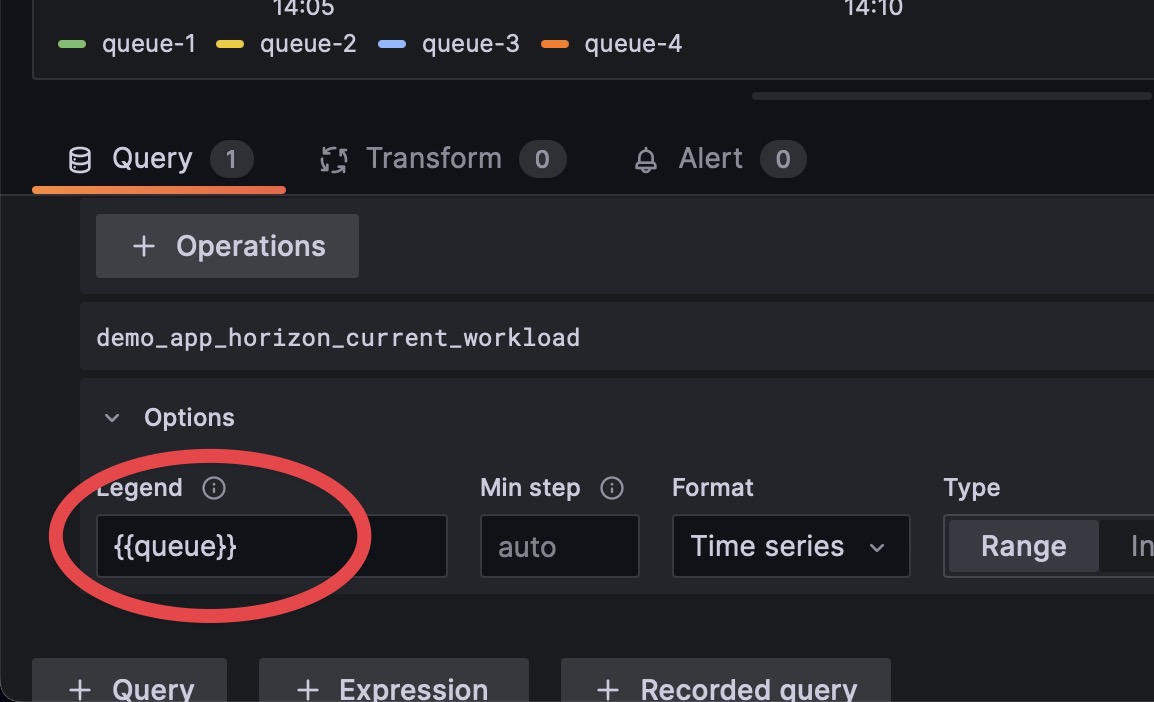
Now save your tile. If you configured everything correctly, and if jobs are being processed on your queue, you should, after a while, see a graph like this one. It shows the trend of waiting jobs per queue.
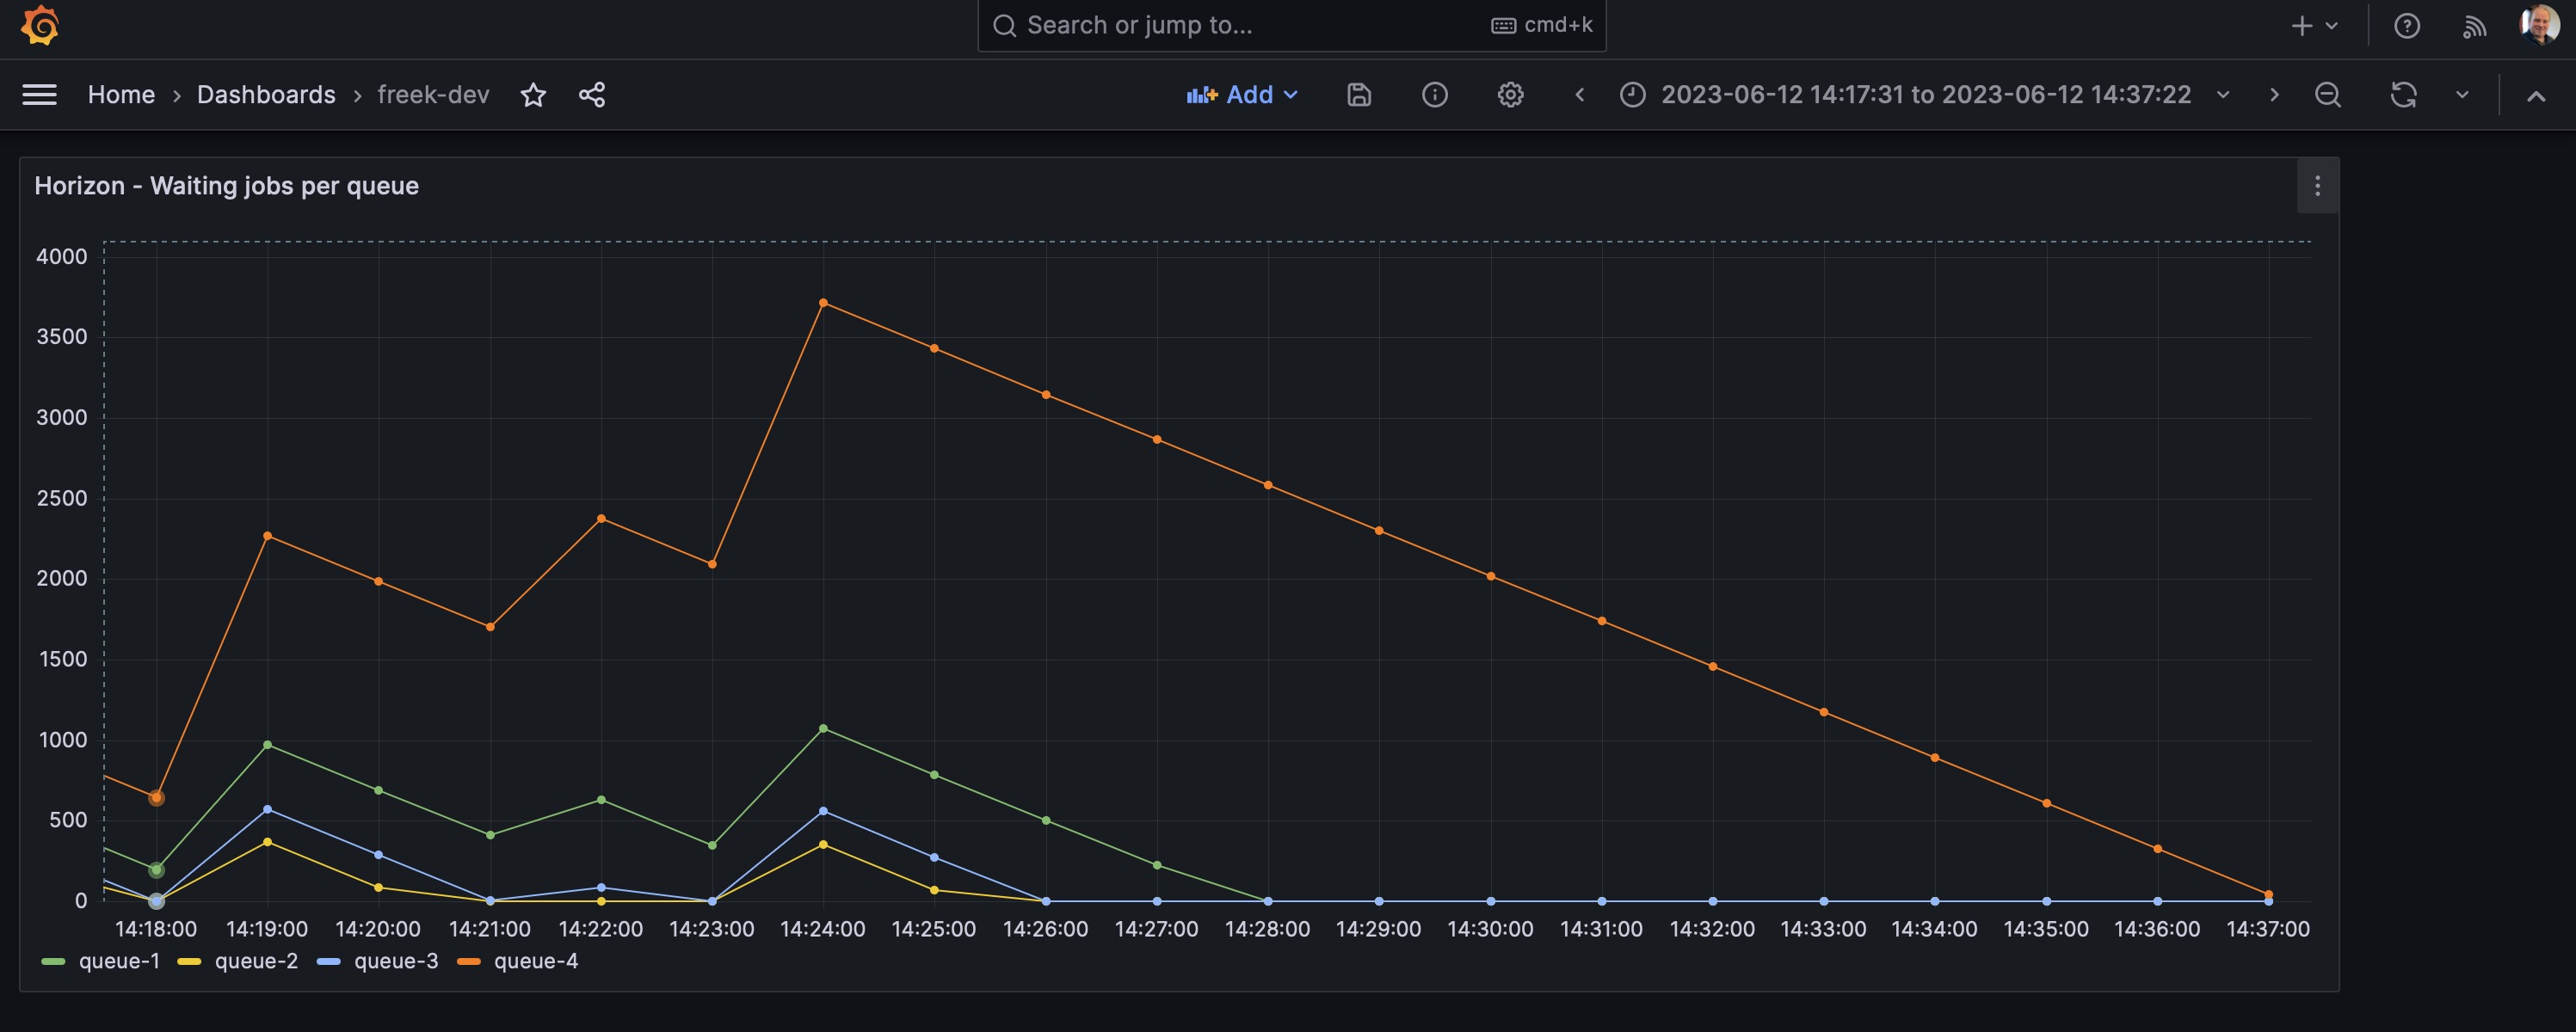
From here on, you can create an expanded dashboard with more tiles, as you would typically do in Grafana. For more information on creating dashboards and tiles, please refer to the Grafana documentation.
In closing
In the blog post, you've learned that visualizing metrics has many benefits. Our Laravel Prometheus package can help you export your custom and Horizon metrics to Prometheus. This blog post covered only some of the options, so be sure to check out the extensive docs.
Currently, I'm using Prometheus / Grafana on all our SaaS that heavily realy on queues: Flare, Mailcoach Cloud, and Oh Dear.
This isn't the first package we've made. Please look at this extensive list of Laravel and PHP packages we've made before. I'm sure there's something there for your next project. If you want to support our open-source efforts, consider picking up one of our paid products or subscribe at Mailcoach and/or Flare.