Introducing Ray: a debugging tool for pragmatic developers original
I'm proud to announce the immediate release of Ray, a desktop app that vastly improves your debugging experience. Ray is a dedicated window to send dumped values to. It has a lot of features that help you find and fix bugs faster.
Ray is available for macOS, Windows and Linux.
In this blog post, I'd like to share why and how we've built Ray. If you just want to know what Ray is, head to the Ray homepage.
The two approaches of debugging in PHP
When debugging in PHP, you can choose between two approaches.
First up is Xdebug. Created by Derick Rethans, this incredibly powerful PHP extension allows you to pause the code, set breakpoints, inspect, and change any variable.
There are a couple of drawbacks, however. It can be hard to install, and it potentially has a significant negative impact on your code's performance. Though the recently released v3 of Xdebug contains improvements on both fronts, it can still be daunting to set up.
The second way of debugging could be called the "dump and die" approach. To find bugs, you'd put var_dump or dump calls in your code. When you execute your code, these dump statements allow you to see the contents of variables and discover which parts are being executed.
A few months ago the author of Xdebug tweeted this controversial statement:
PHP developers that don't use Xdebug for debugging are amateurs.
— Derick Rethans (@derickr) June 20, 2020
A lot of people, including myself, strongly disagree with Derick on this one. The "dump and die" approach has a lot of advantages. You don't need to install or set up extra software. Xdebug only show you the application in one frozen state (granted you can step through). You can see program state from multiple time steps at once. In most cases, dumping stuff won't slow down your code. It's easy to add and remove var_dump, dump, and related calls. I believe that, because it's so easy to do, most developers, including myself, reach this debugging approach.
"Dump and die" debugging also has some drawbacks of its own:
-
If you forget to remove a
var_dumpor similar statement before pushing to production, you're now displaying debugging information in production. -
When debugging a medium-sized problem, you might put
var_dumpordumpstatements in multiple files. When you have fixed your bug, it might be a chore to hunt down all the locations where you've put a debugging statement. I certainly lost time because I couldn't quickly find all locations anymore. -
It's hard to have a hierarchy for the importance of certain statements. You might start to capitalize certain things in the hope that it catches your eye when it is in between a lot of output:
dump('I AM HERE'). -
When debugging a script that renders a web page, the
var_dumpordumpoutput is shown in the browser. These statements will break the layout of your app. For a few debug statements, that isn't a big deal. But when you have a lot of dump statements, this output can get confusing. On the terminal, there's a similar problem. -
If you've put
var_dumpordumpinside a console command, the output is shown in the terminal. For finding small bugs, this is ok. When you're hunting a more complex bug, you might start to have a lot of debugging output each time you execute your code. This can be confusing too. It's sometimes hard to see if the output is over the current execution or the previous one.
I, and a lot of people around me, reach for "dump and die" debugging the whole time. The benefits are, in a lot of cases, bigger than the drawbacks.
Wouldn't it be nice if there was a third approach of debugging? Something in between the "dump and die" approach and Xdebug? Something straightforward to install, but doesn't have the drawbacks of "dump and die"?
My team and I have created that third approach. We call it Ray!
Ray, the new third approach for debugging
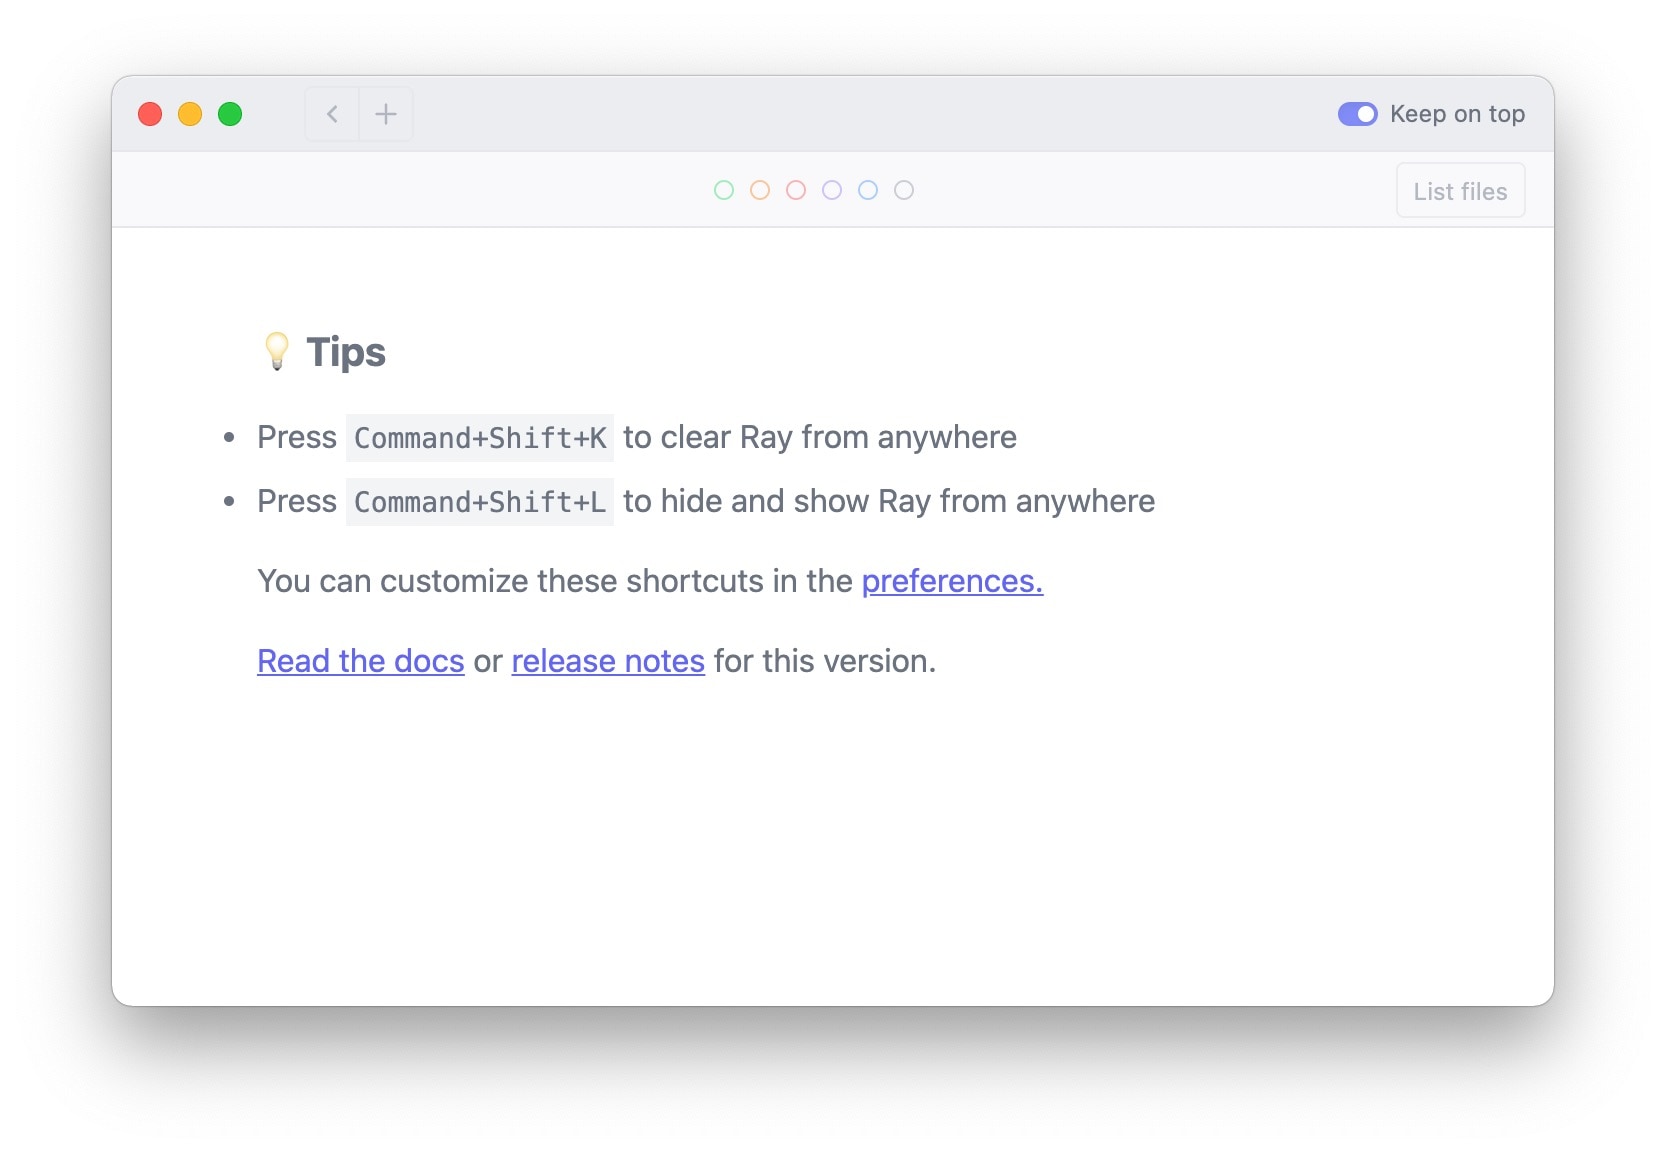
Ray is a desktop app for macOS and Windows. It displays debugging information in a dedicated window. This is what it looks like when you first boot it up:
You can send something to Ray using the ray() function that you'll have access to when you install the framework-agnostic spatie/ray or Laravel specific spatie/laravel-ray package.
Here's an example:
ray('my first debug statement');
This is what that looks like in Ray:
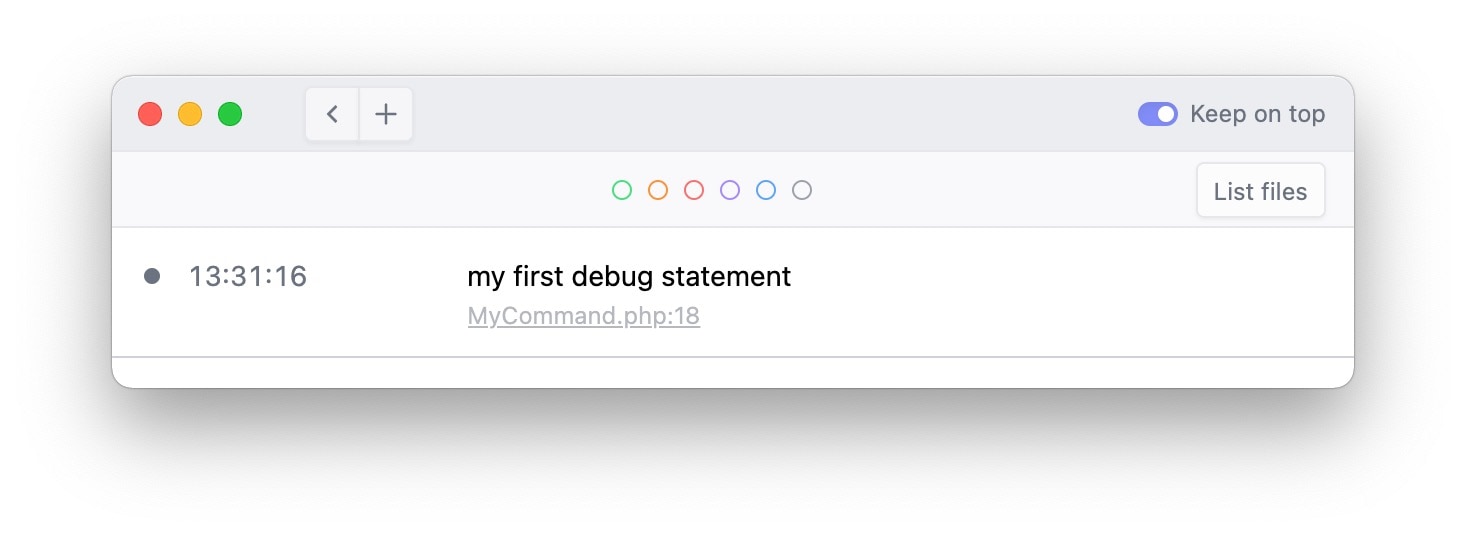
You can see that underneath the string we've sent to Ray, you see a link to where that ray statement was executing. Clicking that link will take you to that location in your IDE (we support PhpStorm, VScode, Sublime, and many others...).
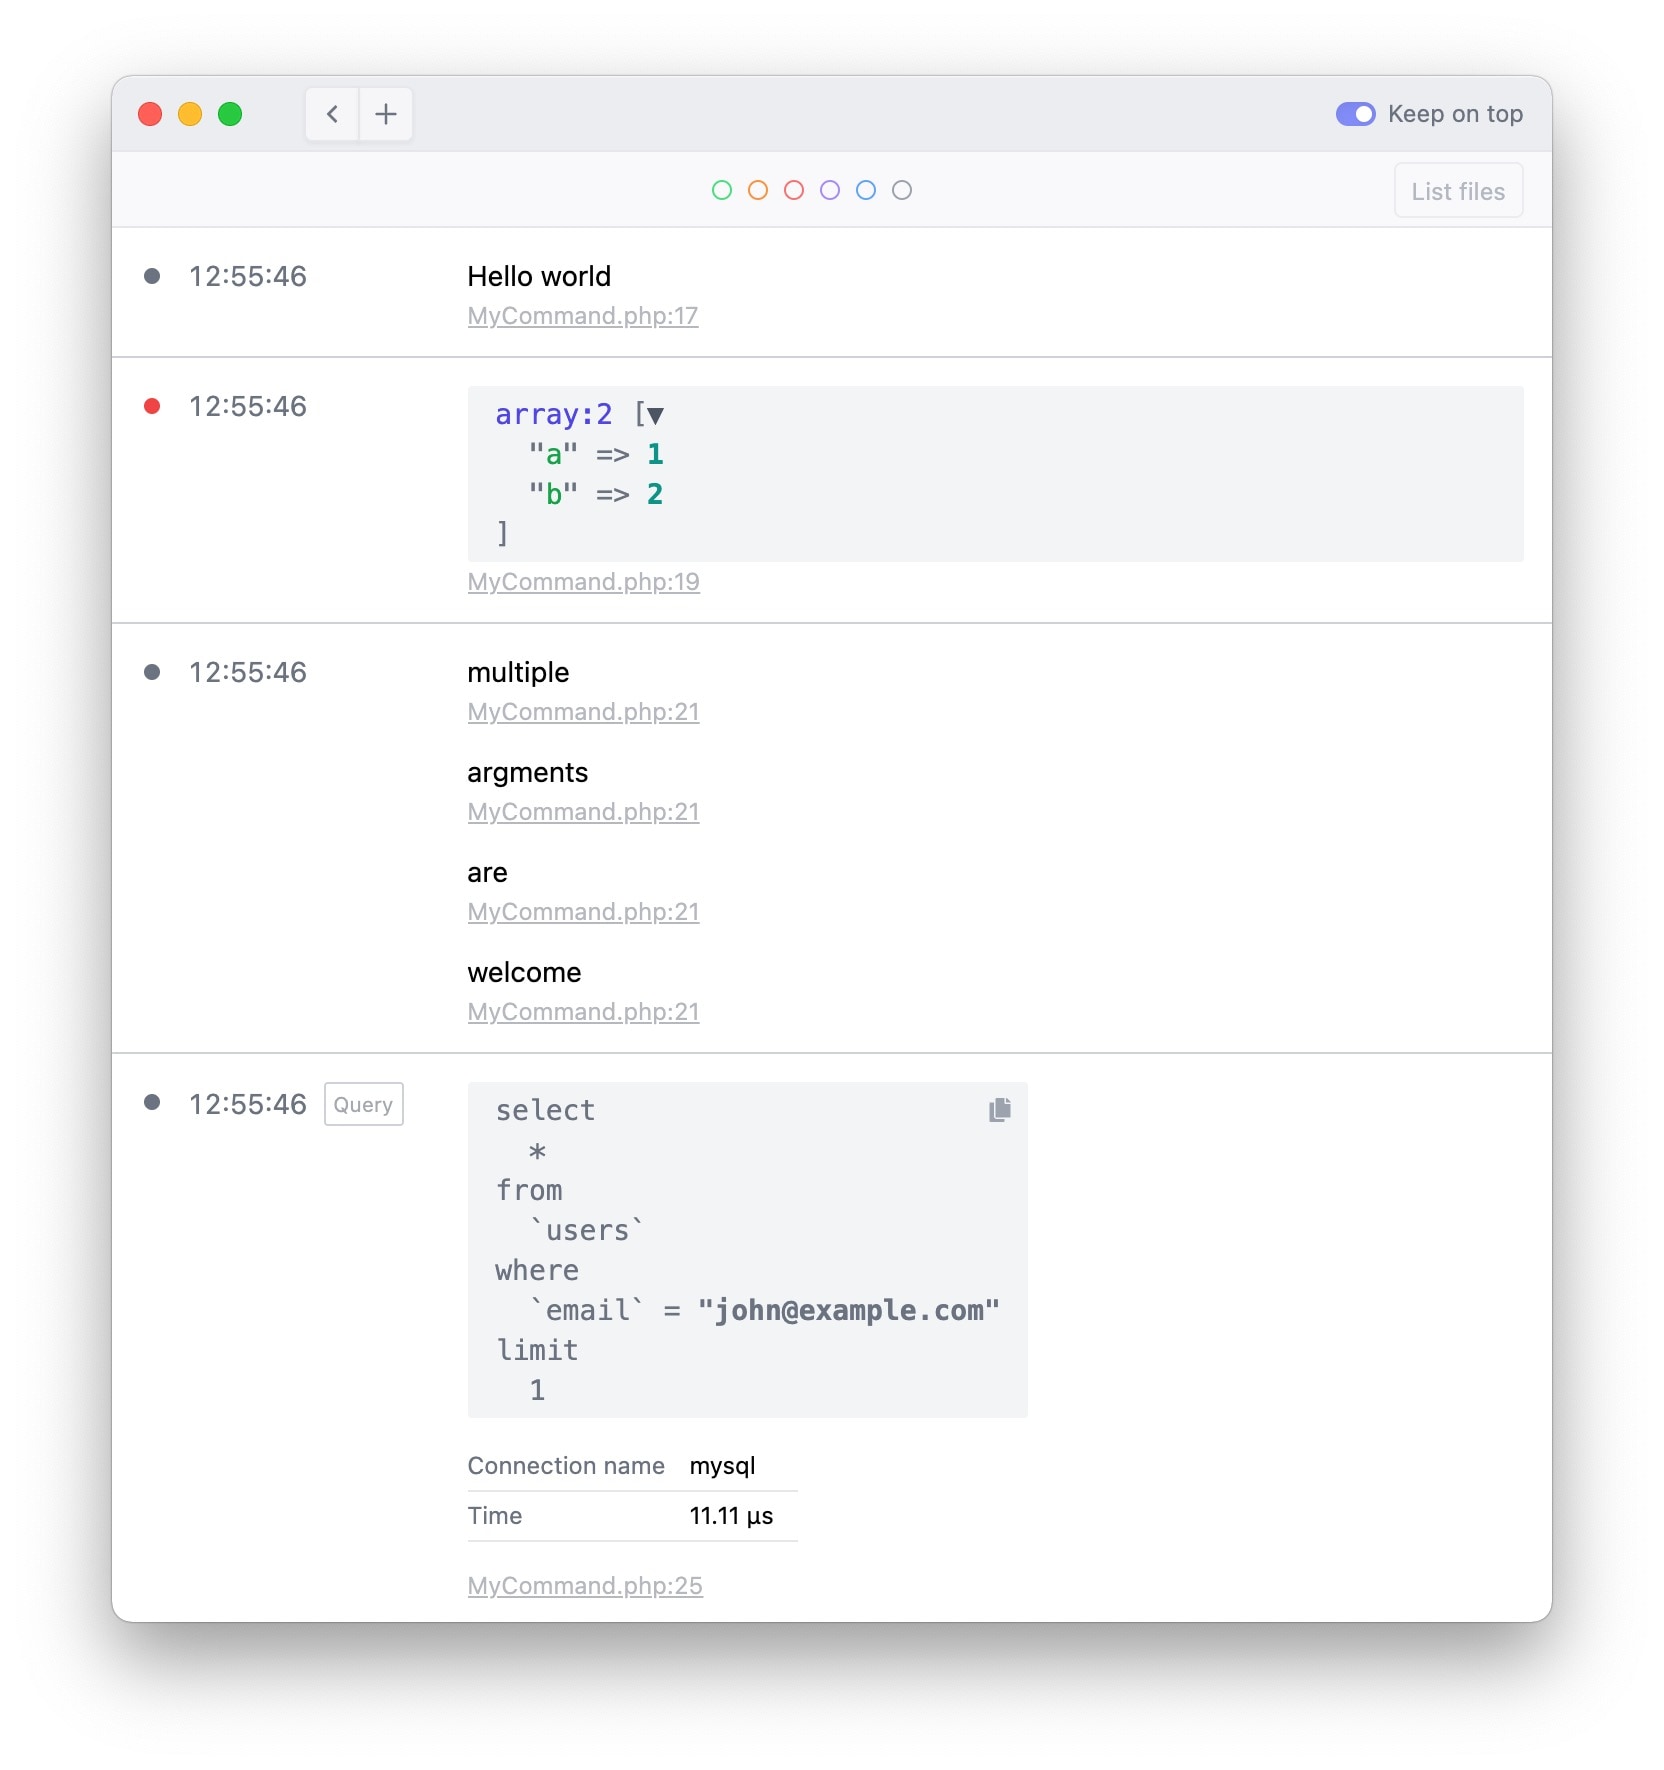
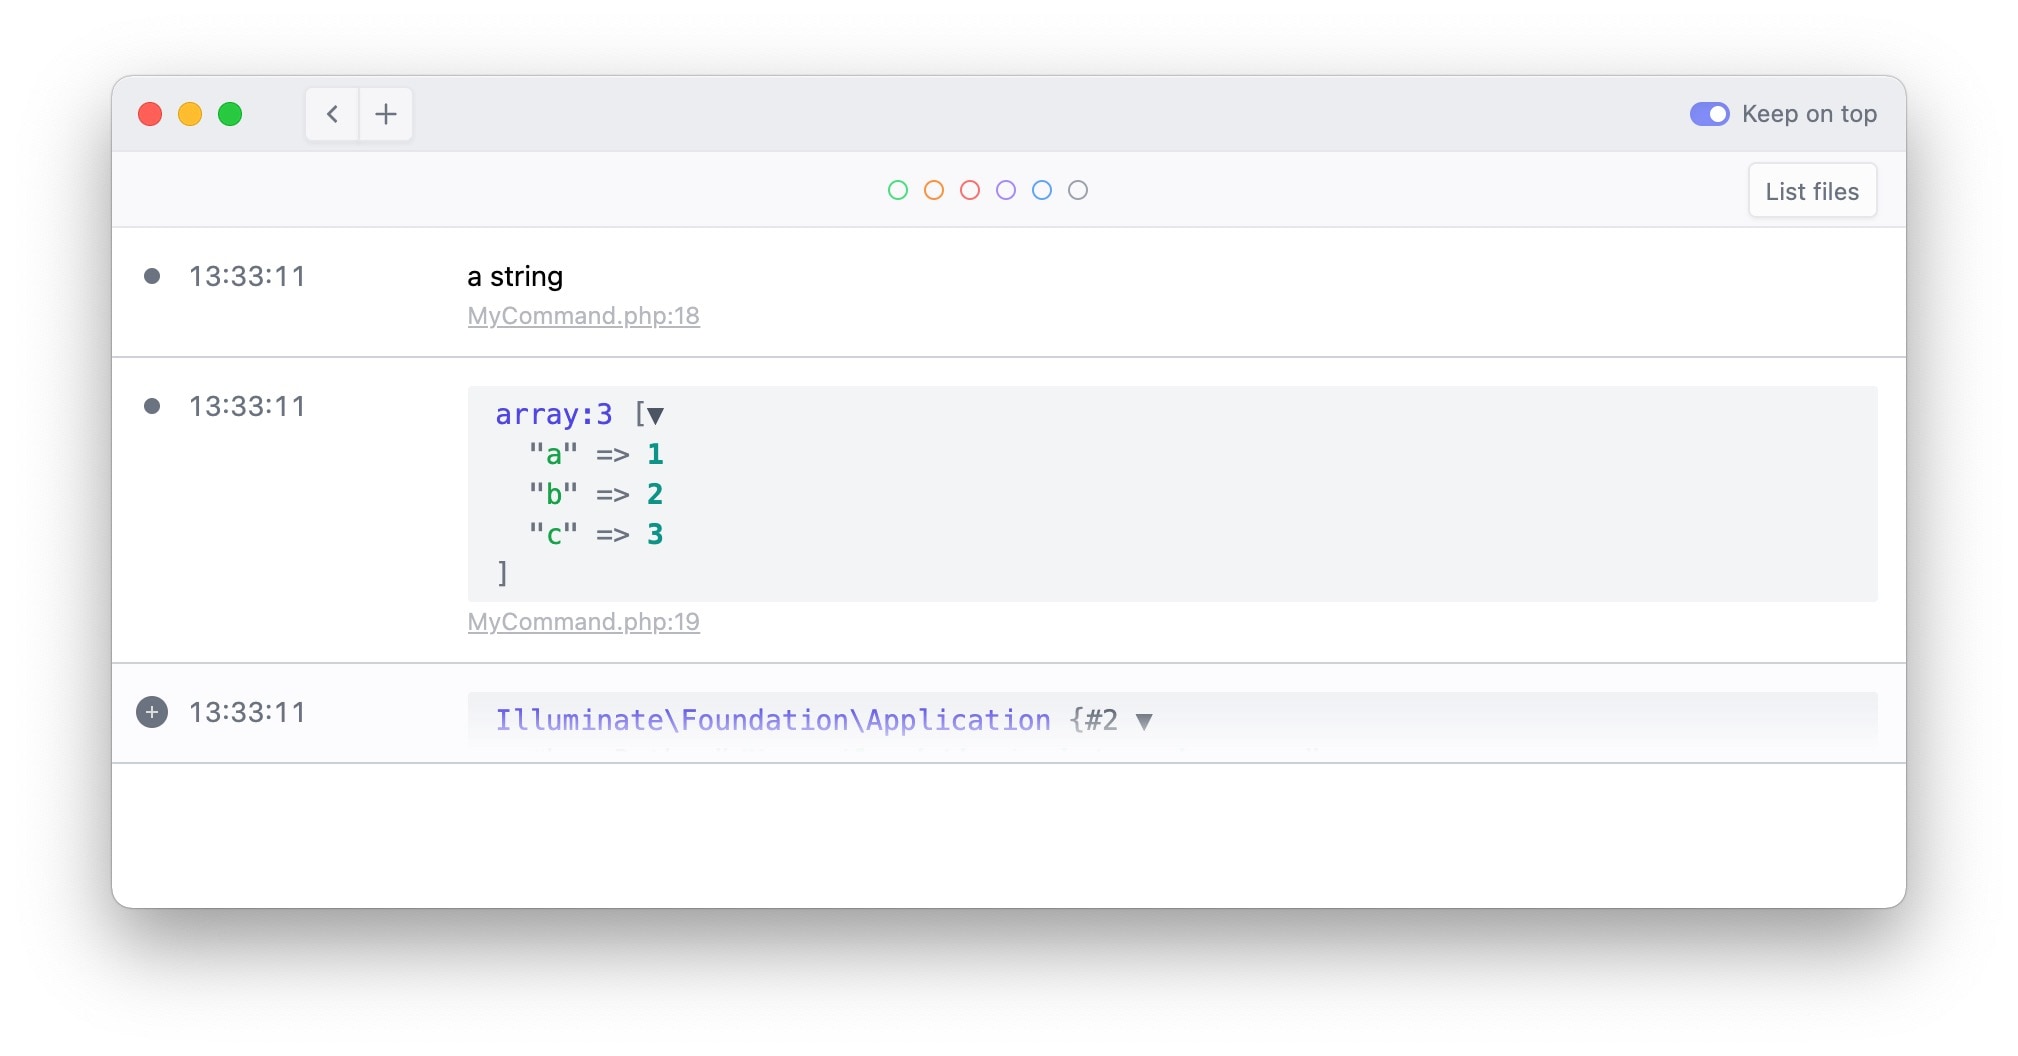
That ray function accepts everything: strings, arrays, objects, ... You can also pass as many arguments as you want.
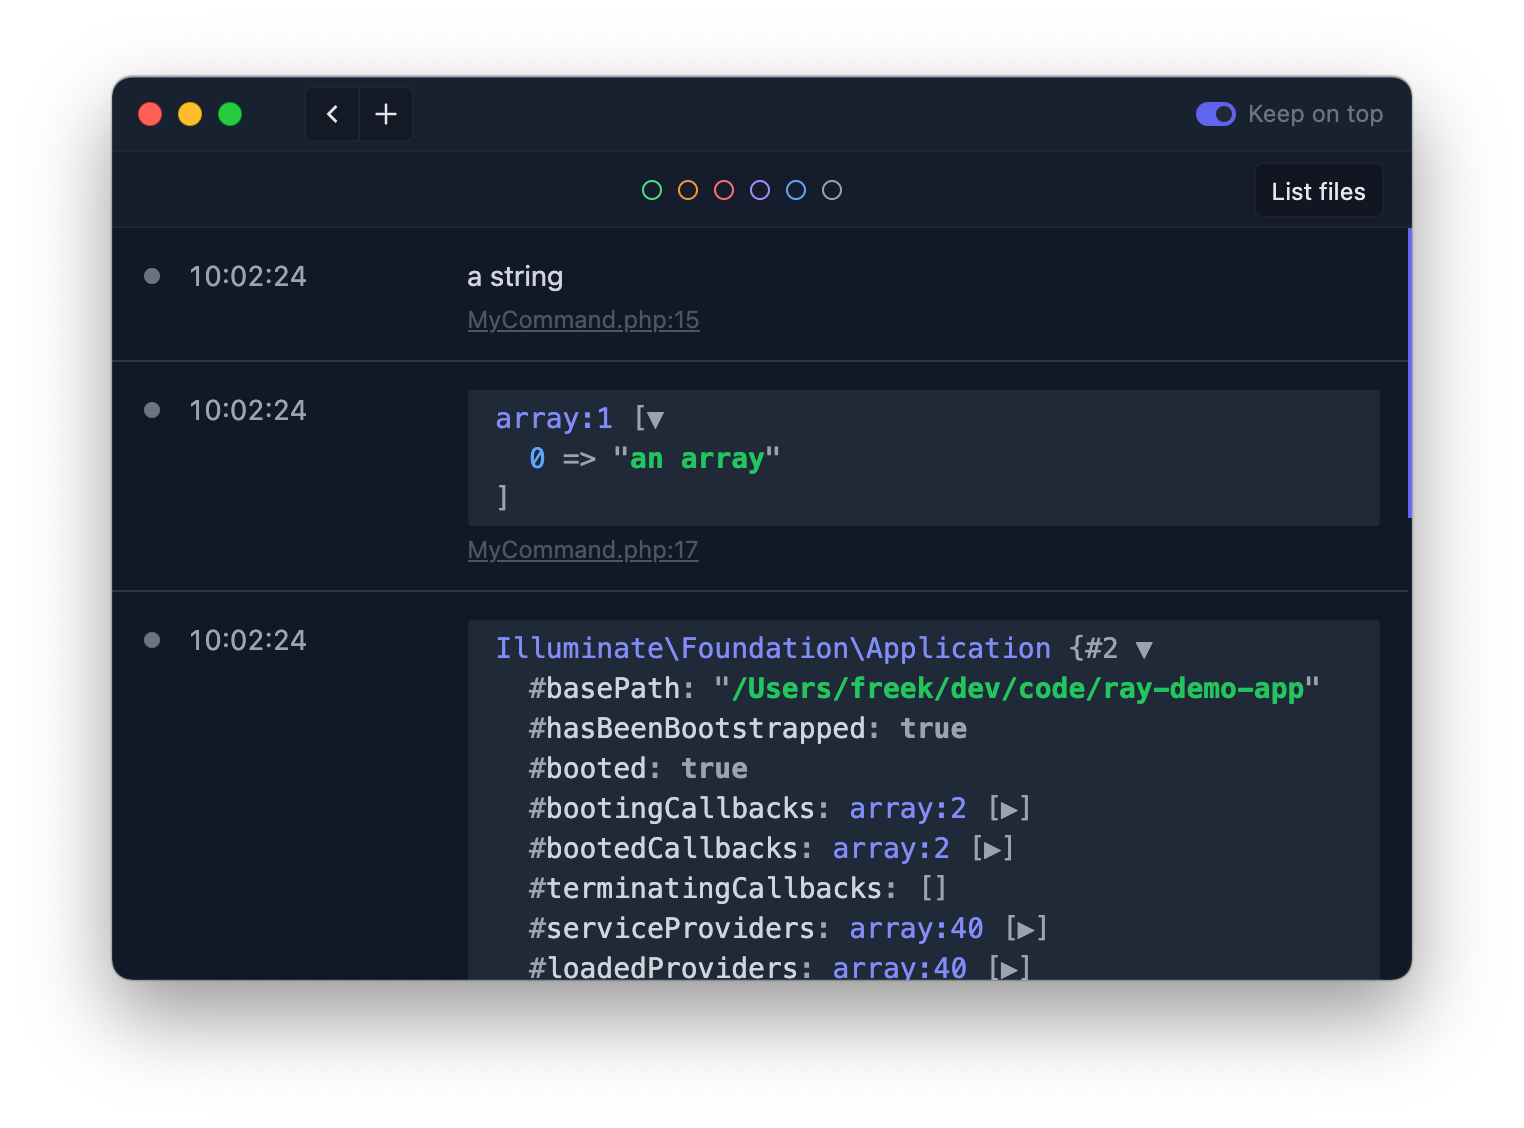
ray('a string', ['a' => 1, 'b' => 2 , 'c' => 3], app());
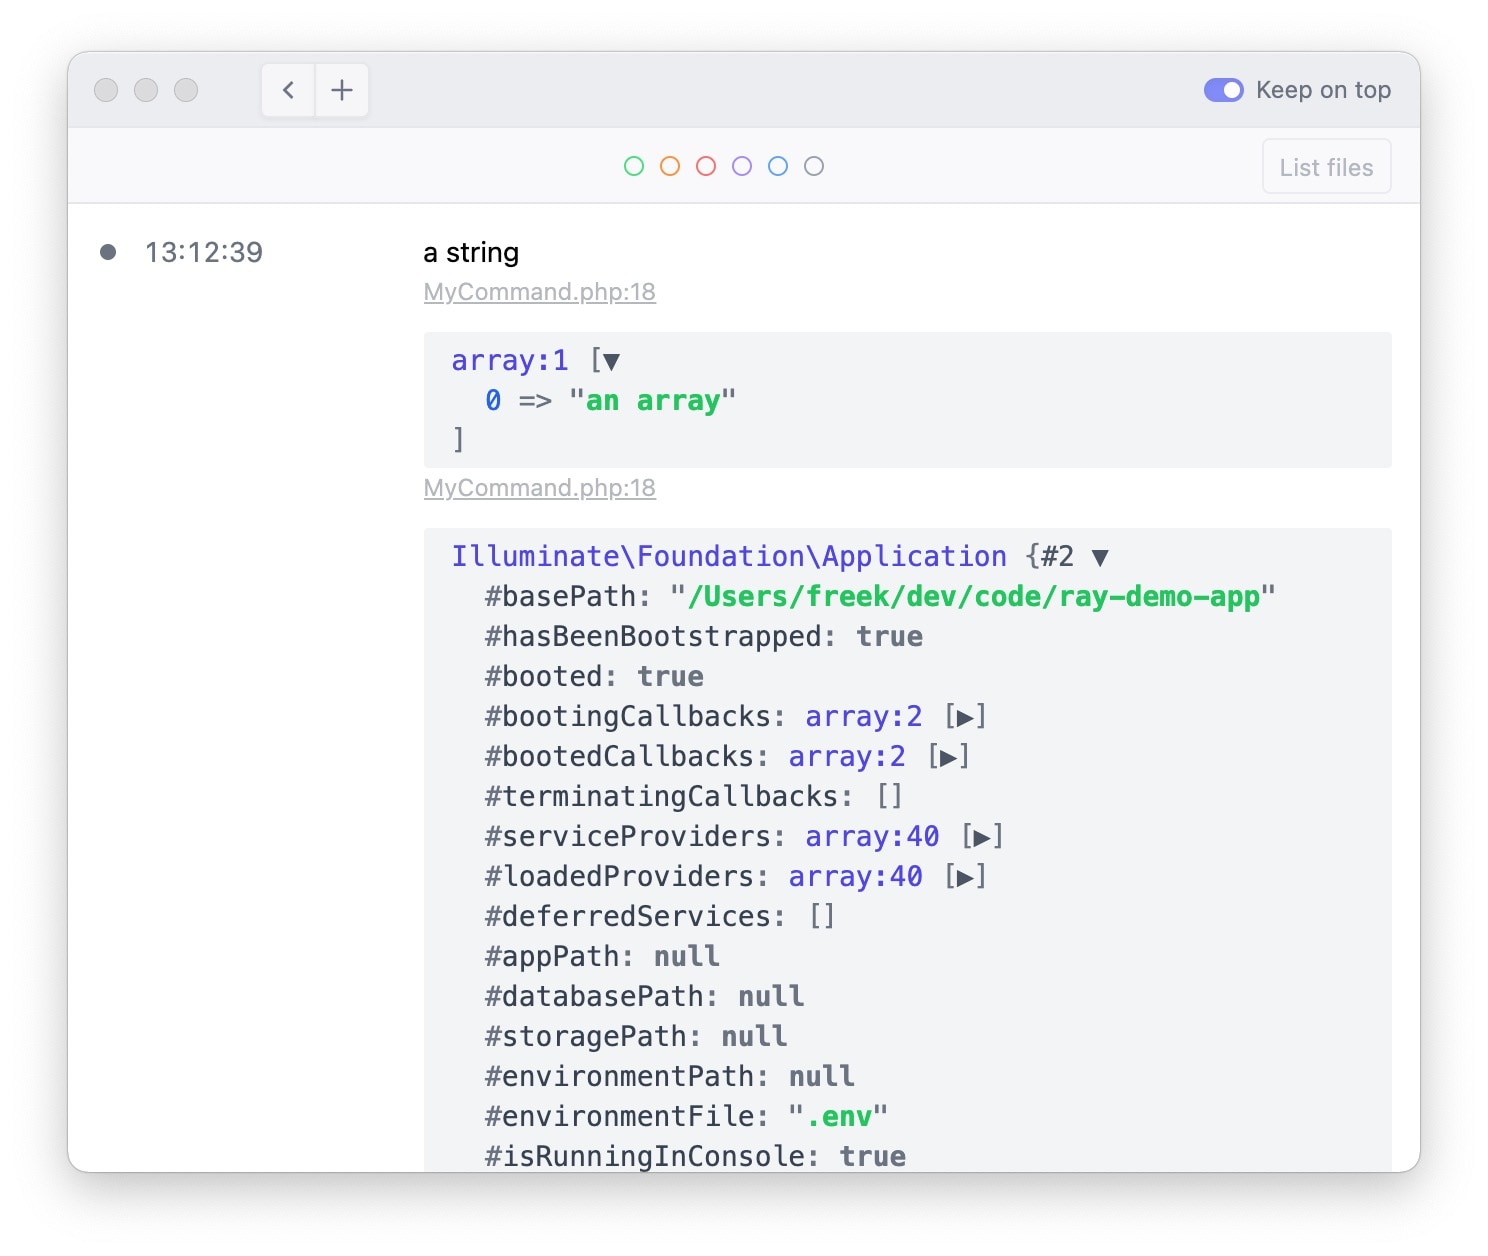
Pieces of large arrays and large object arrays can be collapsed, much like you're used to. In this screenshot, I've collapsed that large instance of Illuminate\Foundation\Application.
When you're debugging medium-size problems, you probably have used multiple dump statements in the past. Some of those statements could be more important than others. In the past, I've distinguished between more and less important statements by writing dump statements in capitals, or by adding some extra characters, so that it catches my eye in between a log of output. Something like this:
dump('I AM HERE');
dump('-------- I AM HERE --------');
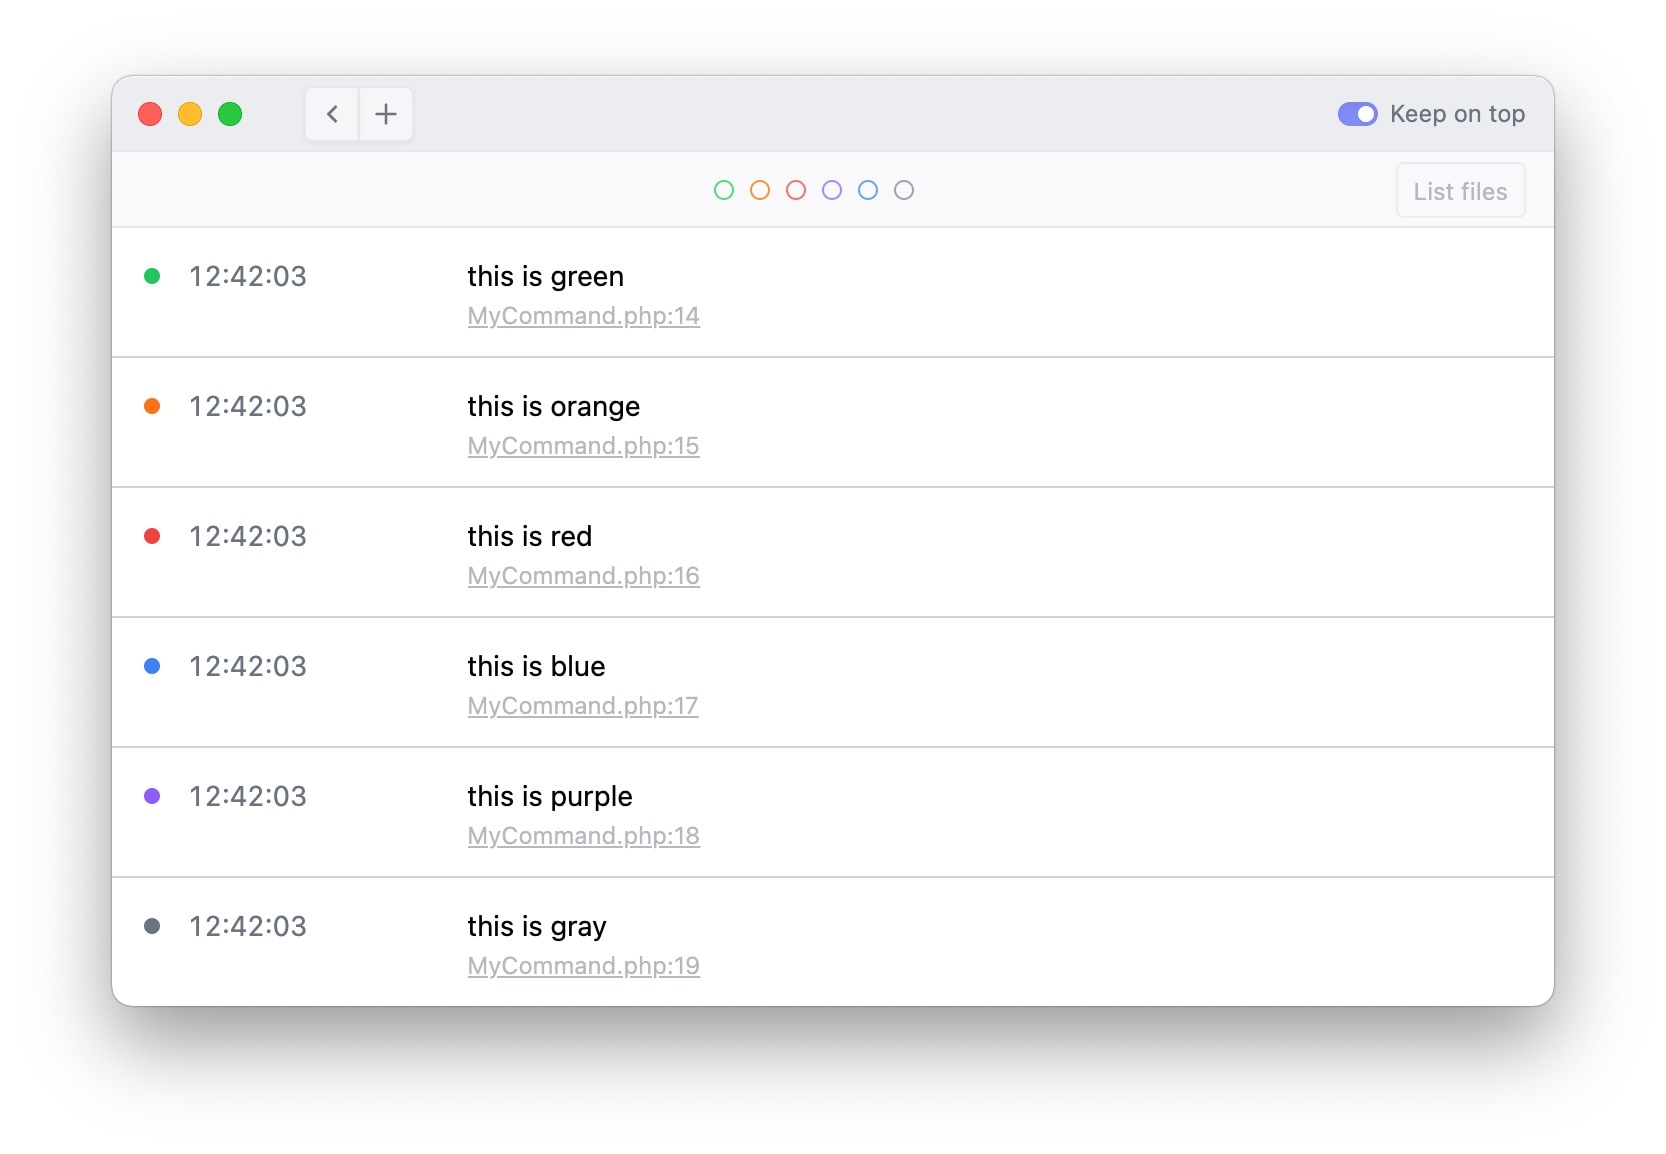
Instead of capitalizing or other tricks to make debugging information stand out, you can colorize statements you send to Ray.
ray('this is green')->green();
ray('this is orange')->orange();
ray('this is red')->red();
ray('this is blue')->blue();
ray('this is purple')->purple();
ray('this is gray')->gray();
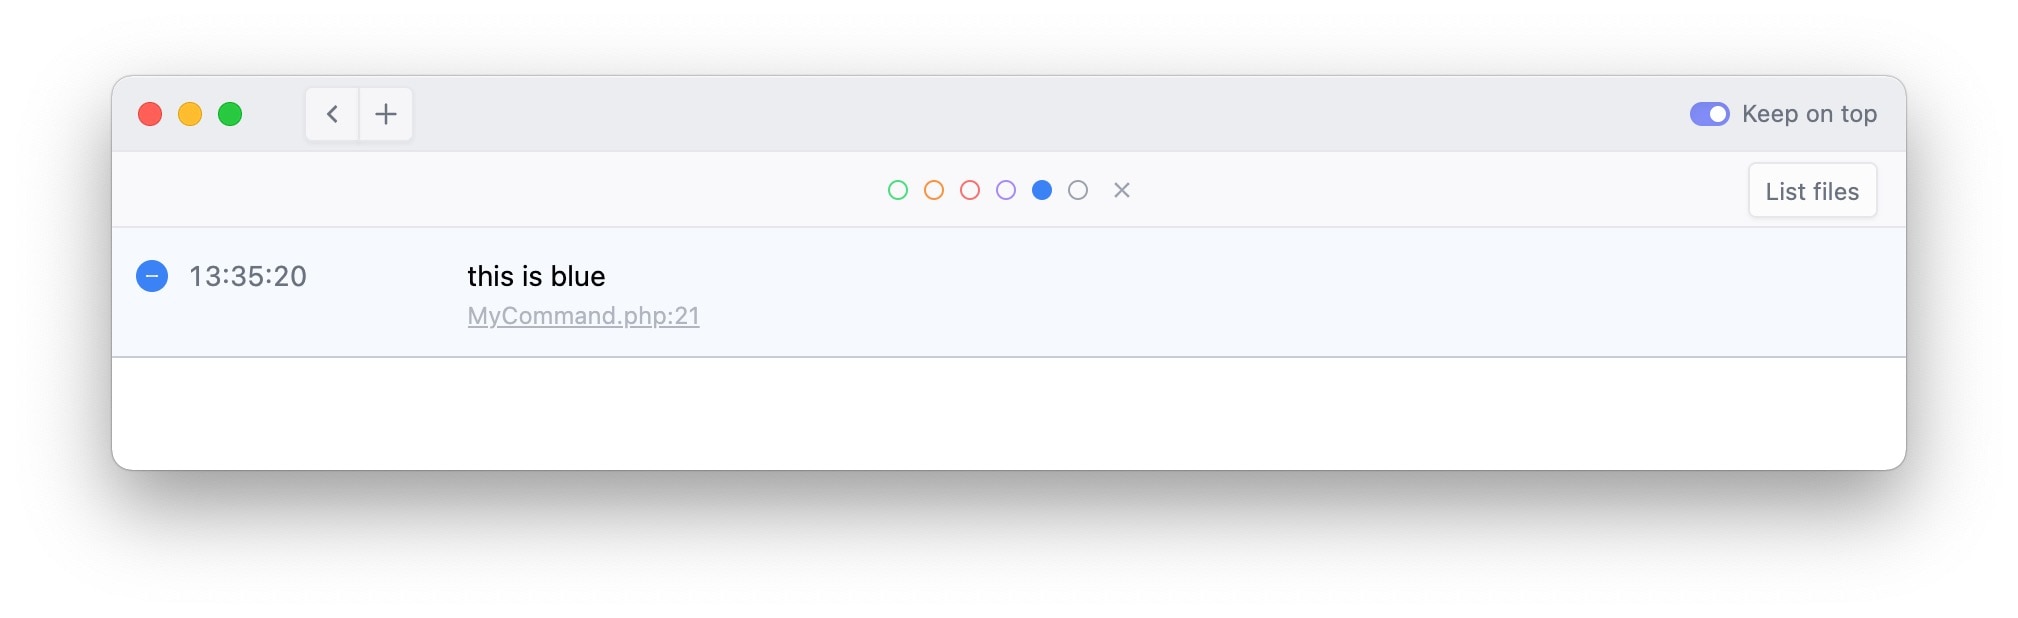
See those little colored dots at the top of the UI? You can use those to filter out items with that color. Here's how it looks like with the blue filter activated:
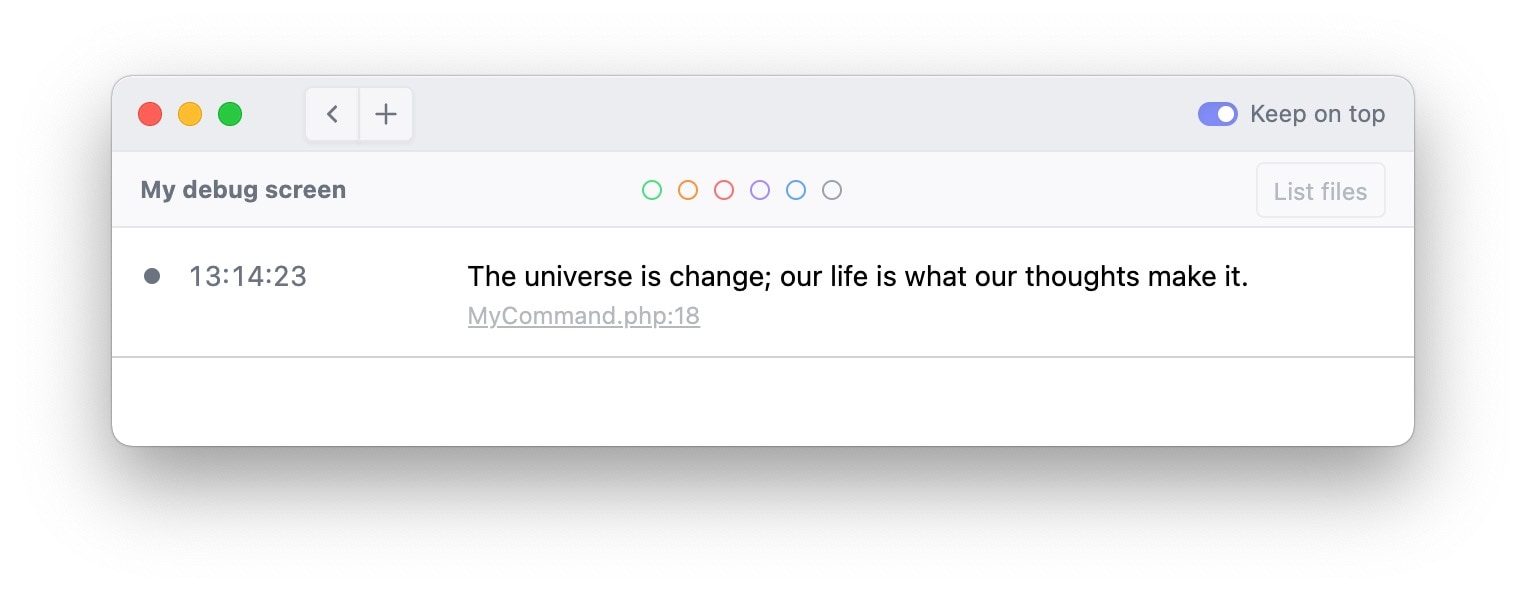
When you're debugging a semi-complex bug, you might need a few iterations to find the bug's cause/solution. Wouldn't it be nice if Ray would only show the debugging output of the current iteration? You can achieve that by calling ray()->newScreen(). Here's an example where we are debugging a console command. Each time the console command is executed, you'll only see the debugging output of that execution. You can even give a screen a name.
namespace App\Console\Commands;

use Illuminate\Console\Command;

class MyArtisanCommand extends Command
{
    protected $signature = 'my-artisan-command';

    public function handle()
    {
        ray()->newScreen('My debug screen');

        //

        ray('The universe is change; our life is what our thoughts make it.');
    }
}
Of course, you can use that newScreen wherever you want. Only want to see the debugging output of the latest Laravel request? Just put in ray()->newScreen() somewhere early in your request (a service provider could be a good place). Want to see the output of the previous iteration? Just click the back button in the top left of the UI.
When you're done debugging, you want to remove all ray() calls. Underneath each item, you'll see a link that, when clicked, will take you to the location of where ray() is used. If a lot of things are displayed in Ray, going over the entire output can be cumbersome. To see a summary of unique locations where ray() is being called, click the "List files" button.
Do you think Ray is too bright for your eyes? You'll be happy to now that there's also a dark theme. This is what it looks like.
In this short video, you'll see me demo the basic features or Ray.
By using Ray, you're avoiding all the drawbacks of "dump and die" debugging mentioned in the previous section.
Let's quickly go over them again:
-
When you forget to remove a
dumpstatement when pushing to production, debugging information will be visible to visitors. Ray solves this by not altering your output in any way. Whenray()detects it's being run in a production environment, those calls won't do anything at all. So, forgetting to remove aray()call isn't a problem at all. -
With
dump, it is potentially hard to clean up those statements because you might lose track of where you've put them. Ray solves this by displaying the exact location of each logged item. -
To make things stand out when using
dump(), you might do silly things like capitalizing things. Ray solves this by allowing you to colorize and filter particular output. -
When using
dumpin web requests, it might break your layout. By using Ray, nothing is sent to the browser, so your layout won't be broken. -
If you need a few iterations to find a bug using
dump, seeing debugging output from all iterations might be confusing. Ray solves this by providing anewScreen()method that allows you to clear the screen programmatically.
We didn't stop there. Ray can do a lot more. Let's explore measure performance, pausing code, and Laravel specific niceties in the next section.
Diving deeper
You can manually send strings, arrays, and everything you want to Ray. In addition to that, Ray can display information that helps you to debug problems after.
Quickly measuring performance
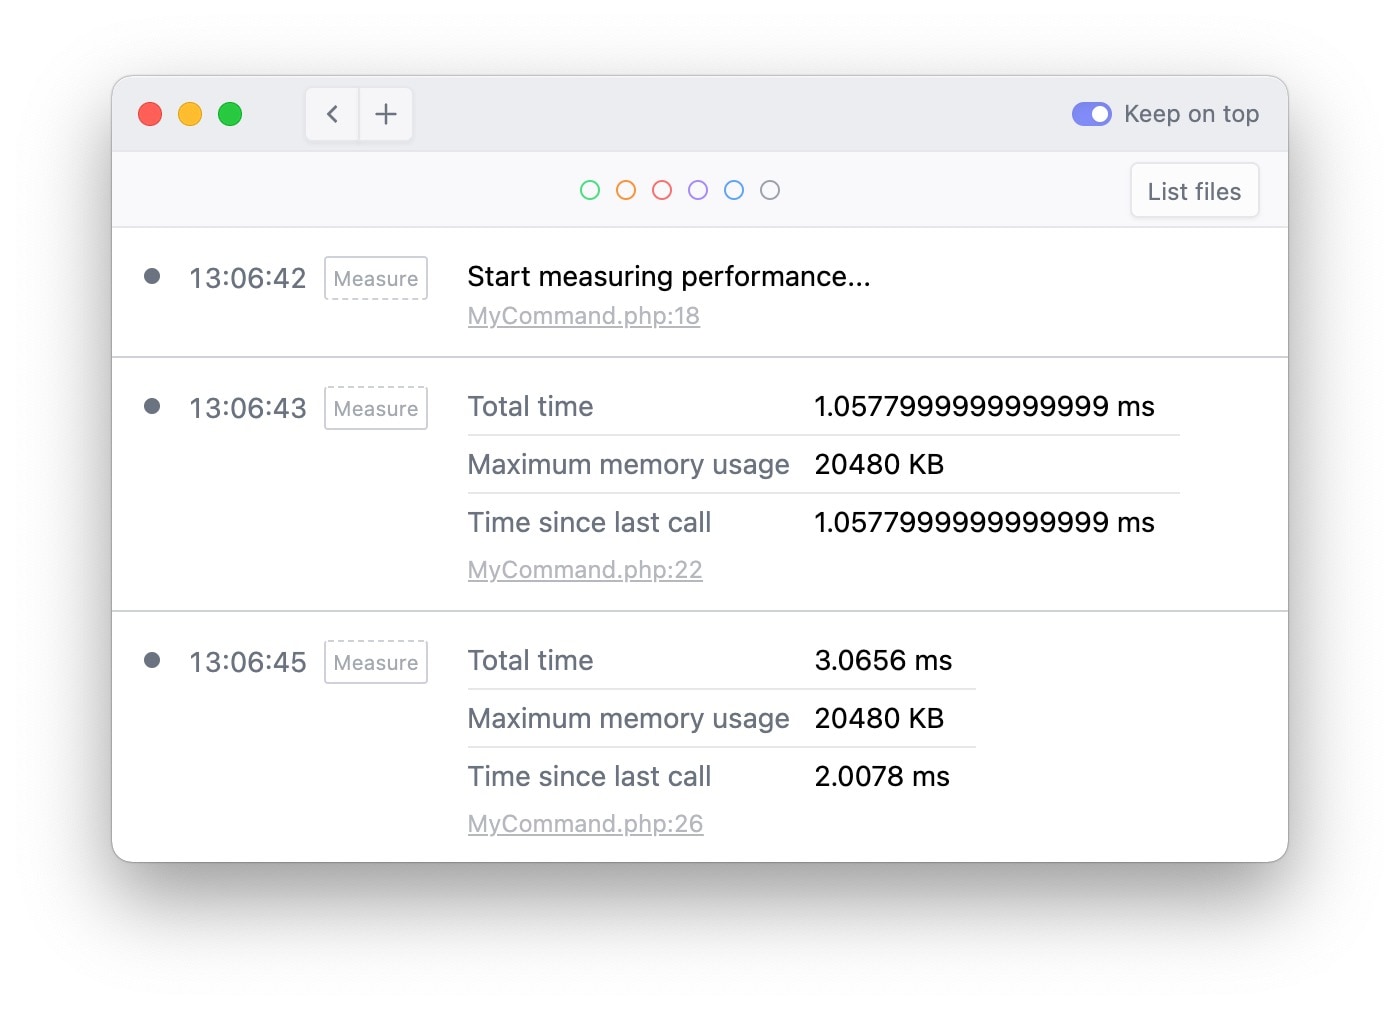
You might want to know how long a certain piece of code takes to run and how much memory it takes. You can easily measure performance by calling ray()->measure(). The first time that it is called, Ray will start to measure performance. The second time measure() is called, it will display the amount of time between the second and first call.
Here's an example:
ray()->measure();

sleep(1);

ray()->measure();

sleep(2);

ray()->measure();
Here is what that looks like in Ray:
Pausing the execution of your code
This feature is a little bit mind-blowing: Ray can pause your code. This can be useful when you want to see your code's side effects (what got written to the DB, which API calls were executed?) before continuing.
In this example, we will loop over each user, alter that user somehow, and pause the code.
User::each(function(User $user) {
	$user->performSomeSortOfUpdateOrSideEffect();

	ray("Executed loop for user {$user->id}")->pause();
})
After you've checked in the DB if everything is ok, you can press "continue" in Ray to execute the code for the next user. If you want to stop execution, press "Stop" to have an exception thrown in your app.
Displaying a notification
Imagine you have a piece of long-running code, and you don't want to keep an eye on the Ray window all the time. You might want to see a notification when a specific part of your code is executed.
You can display a notification with the notification method.
ray()->notify('This is my notification')
Seeing where a function is called
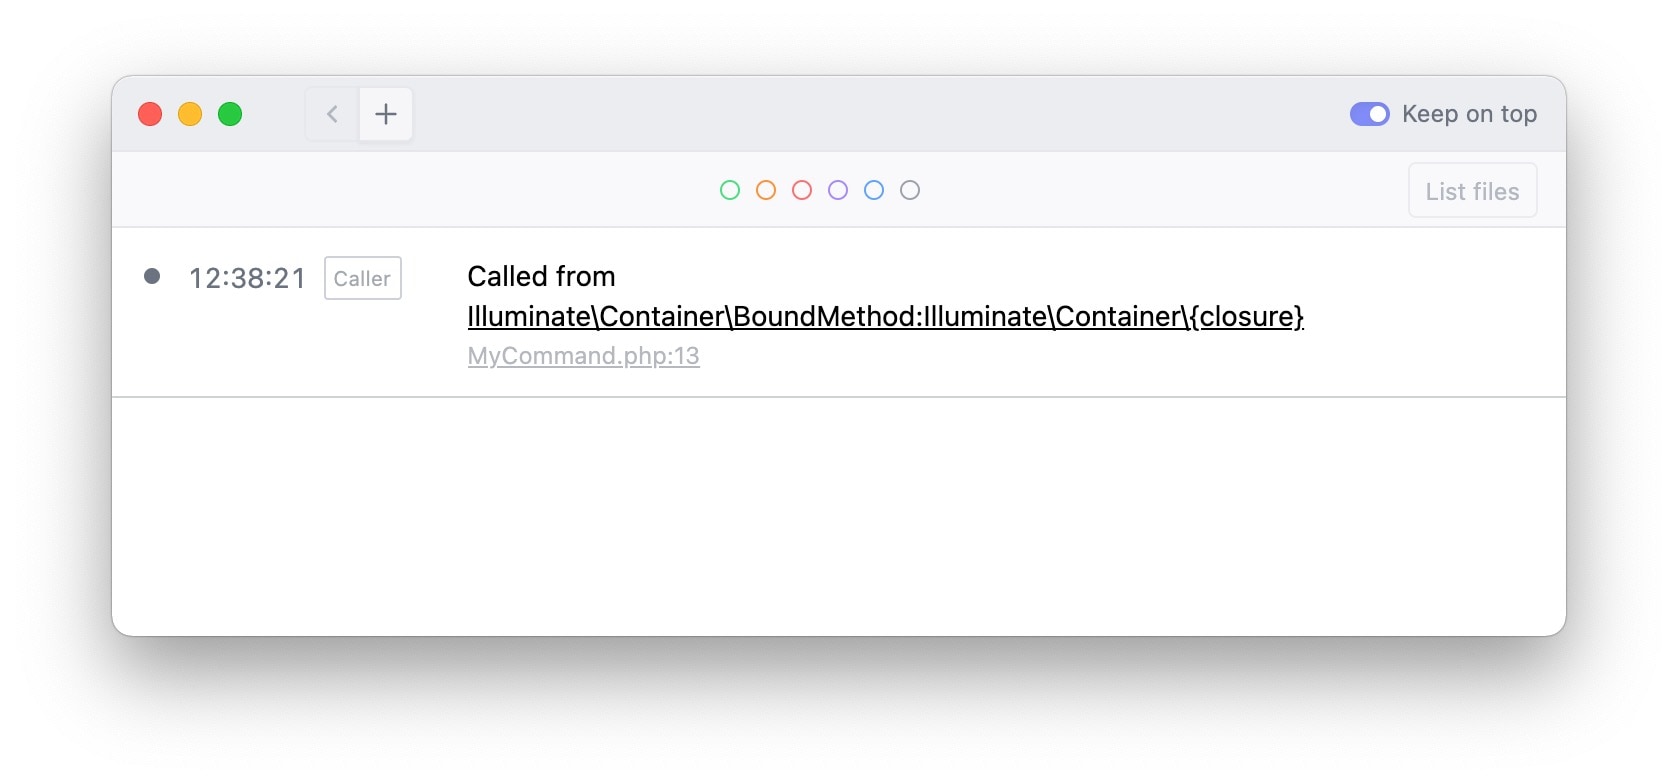
Sometimes you want to know where your code is being called. You can quickly determine that by using the caller function.
ray()->caller();
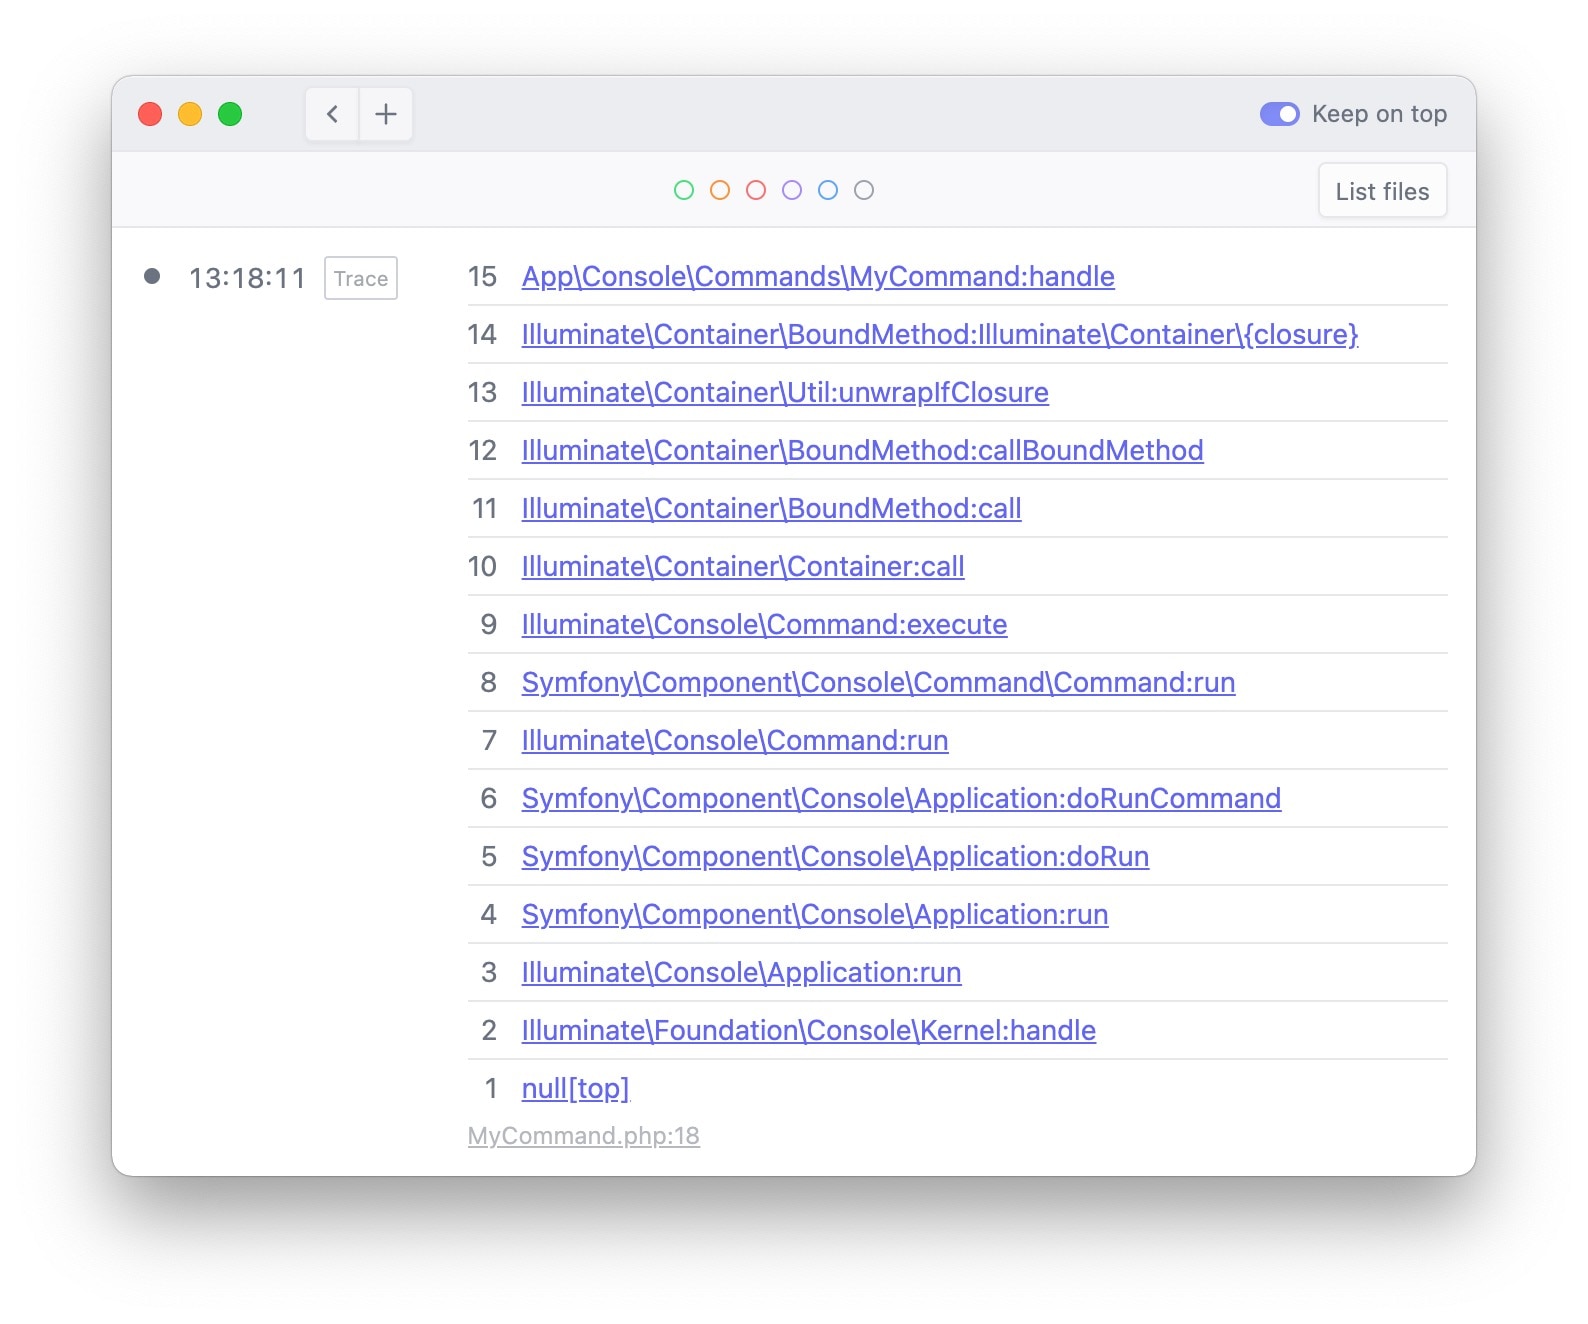
If you want to see the entire backtrace, use the trace method:
ray()->trace();
Updating items in Ray
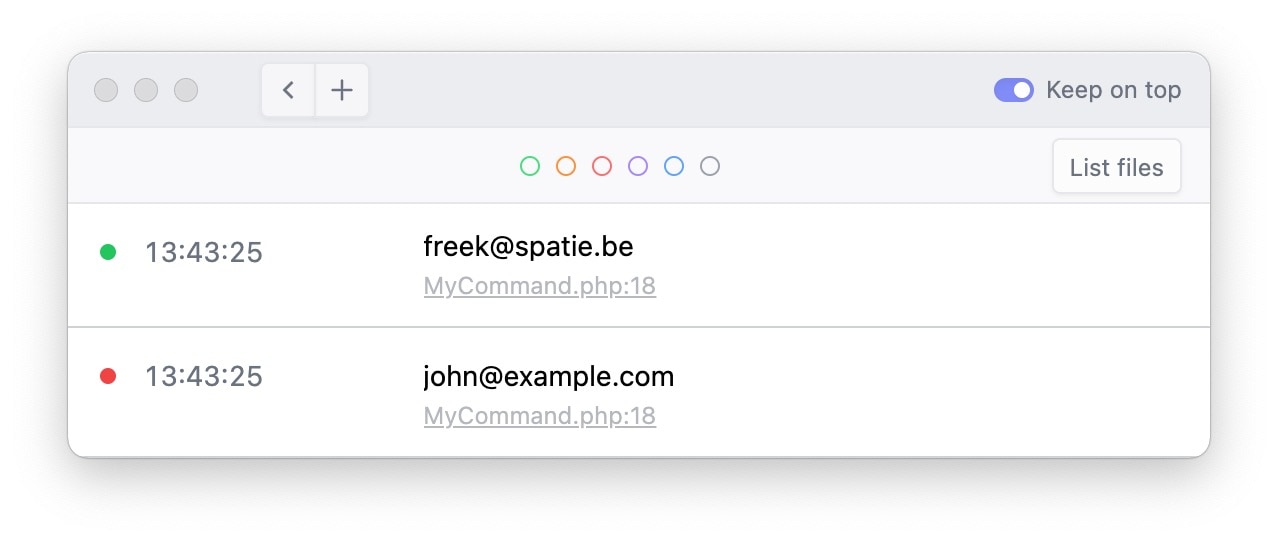
Calling ray returns an instance of Spatie\Ray\Ray that allows you to control the output sent to the screen. That may sound confusing, so let's clarify that with an example. In this piece of code, we will log the email of each user. If the email ends on spatie.be we'll mark it green. Otherwise, we'll mark it red.
User::each(function(User $user) {
	$ray = ray($user->email);

	Str::endsWith($userEmail, 'spatie.be')
		? $ray->green();
		: $ray->red();
});
This is what that looks like in Ray:
Ray loves Laravel
Most of my time is spent creating Laravel apps. I've been using Ray myself these past few months. Whenever I stumbled on something that I thought could be useful in my debugging journeys, I added that functionality to Ray. This results in Ray having quite a lot of Laravel specific helper methods. You'll find them all in the docs.
Let's review the most interesting ones.
Displaying a model
If you dump an Eloquent model, you see many internals of that model that you mostly don't need.
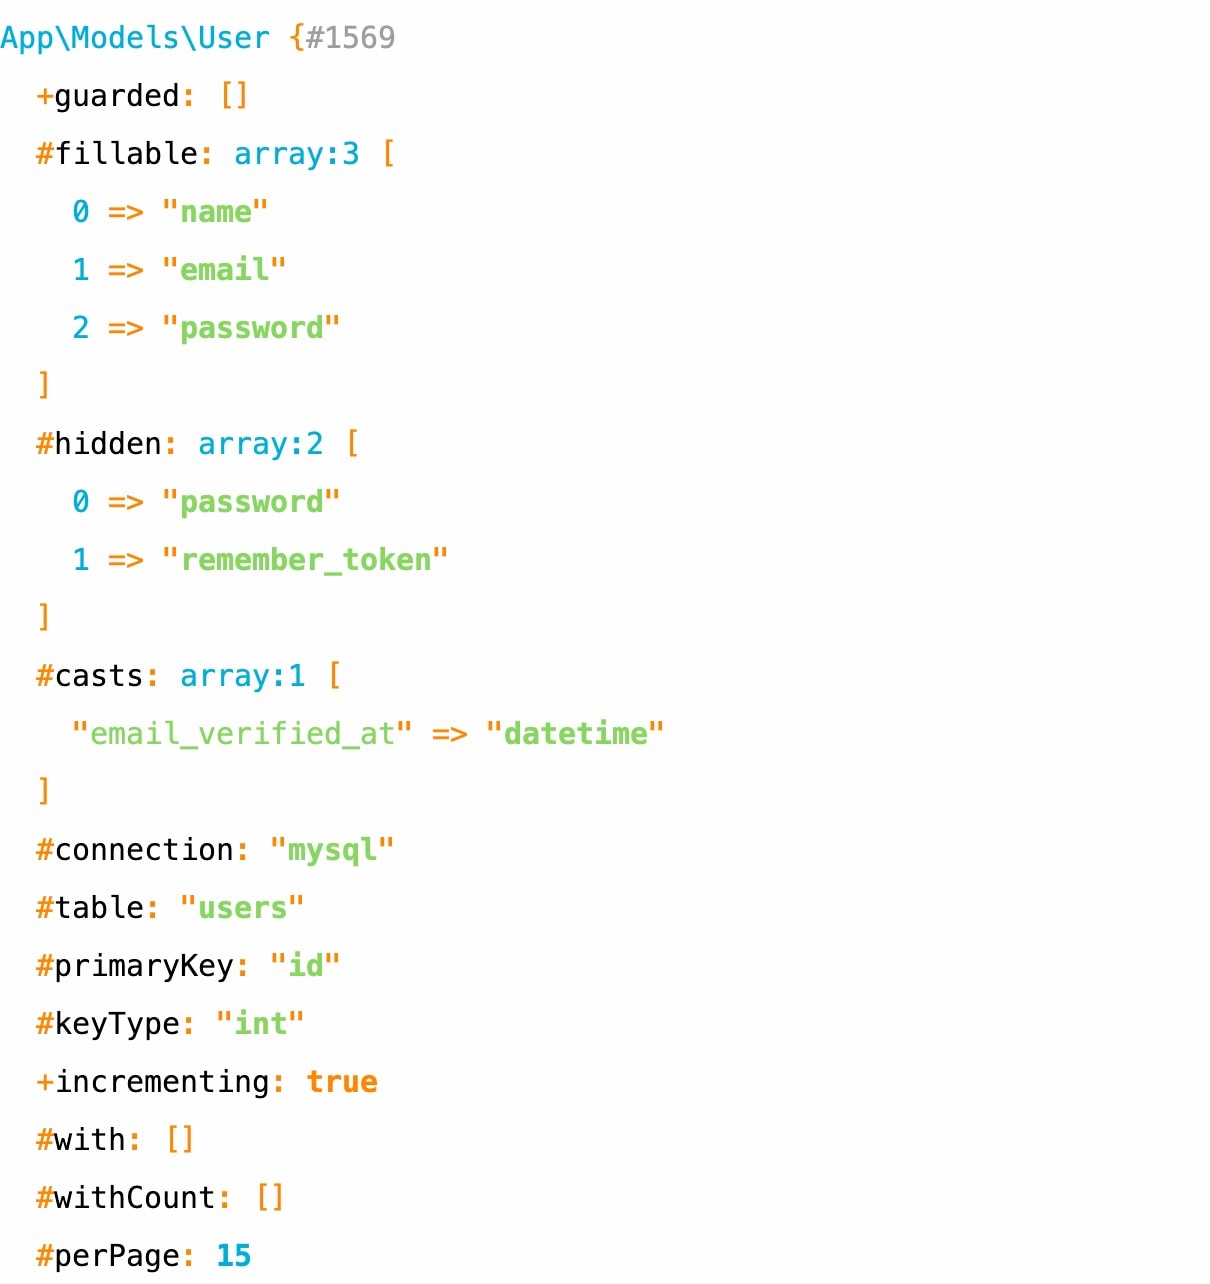
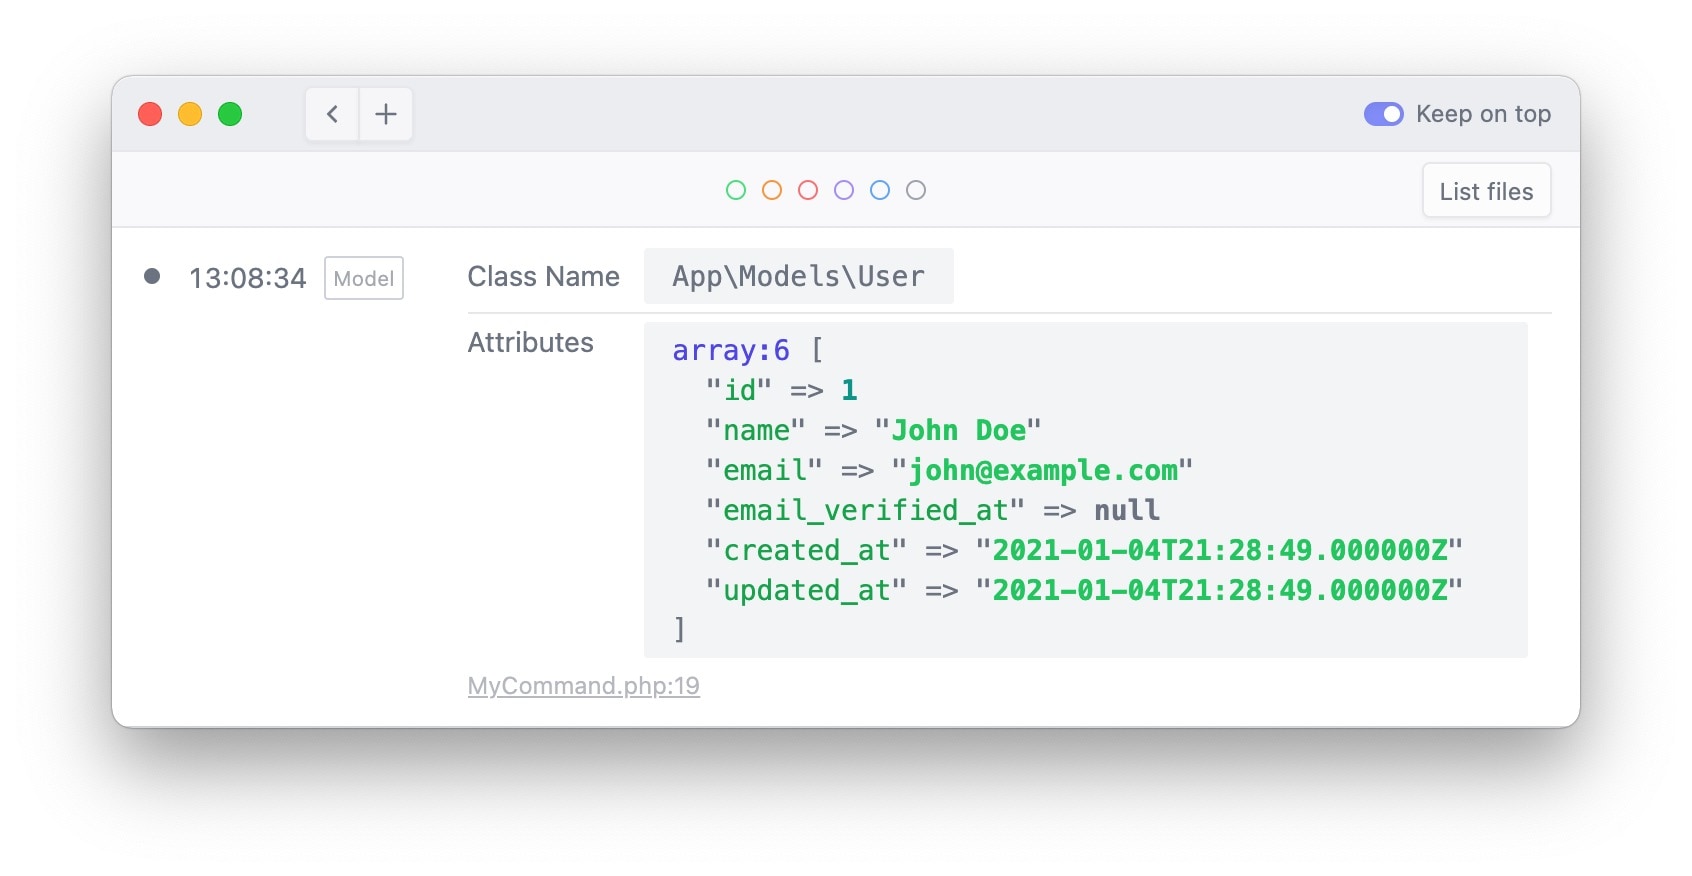
In most cases, you want to see the attributes and/or loaded relations. Calling model() does just that.
ray()->model($user);
Displaying all queries
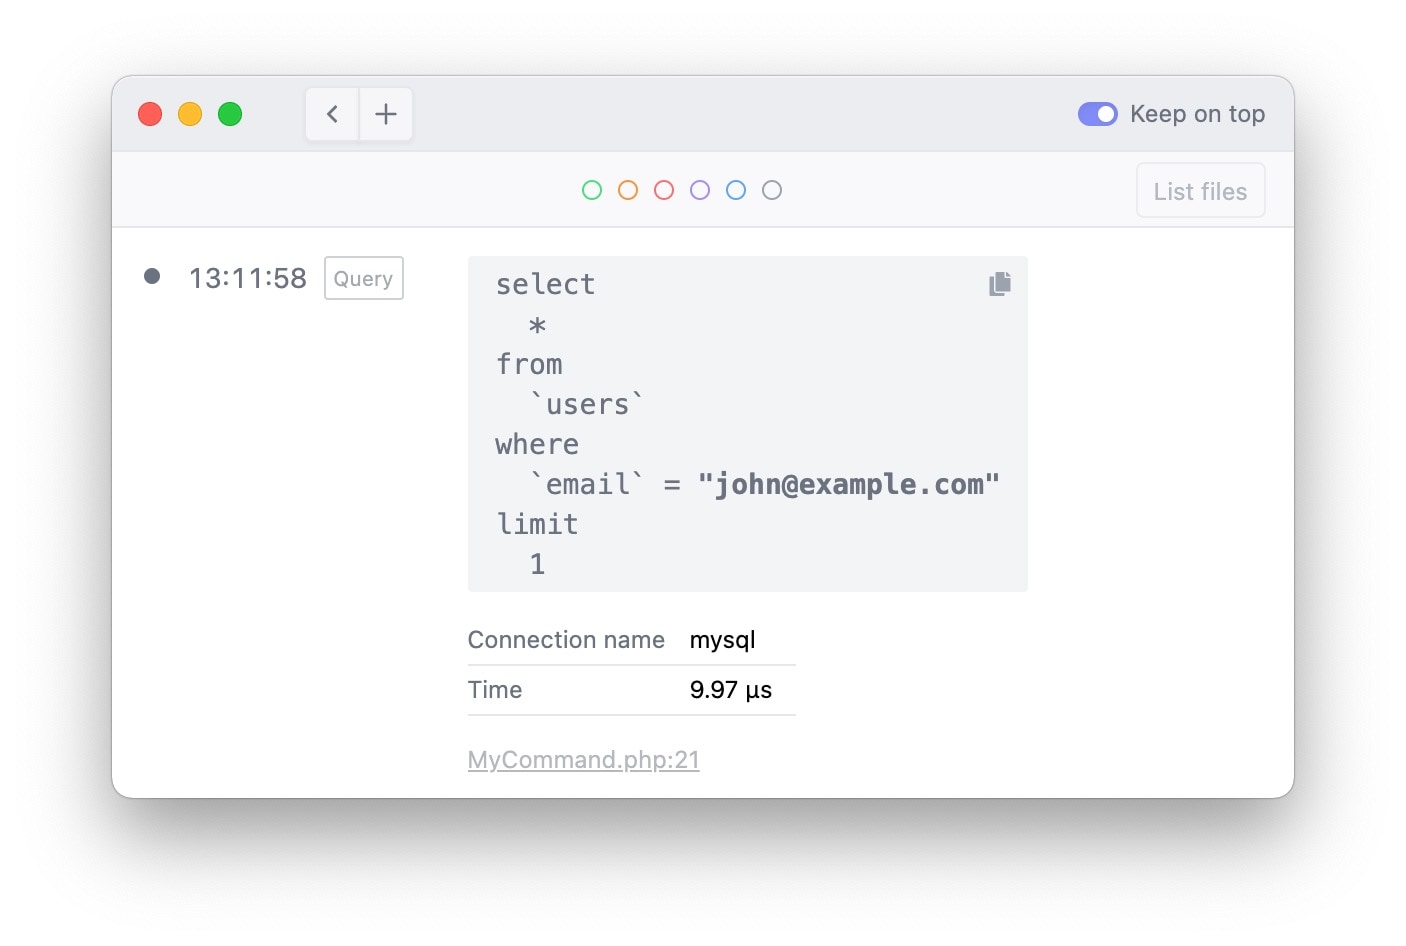
You can send all queries that your code performs to Ray by calling ray()->showQueries();
ray()->showQueries();

User::whereFirst('email', 'john@example.com');
In Ray, we display the executed query with all parameters inlined. You also see the time that was needed to execute the query. Ray even shows you where the query was executed. You can click that link to jump to the origin of the query.
If you don't want to send any queries anymore after a certain point in your code, you can call ray()->stopShowingQueries().
Alternatively, you can pass a closure to showQueries to only show the executed queries in the given callable.
ray()->showQueries(function() {
	// some code that executes queries
});
Displaying log items (and mailables!)
By default, anything that is sent to the log is displayed in Ray as well.
// these are automatically sent to Ray
Log::info('using the facade to log something');
info('using the helper function to log something');
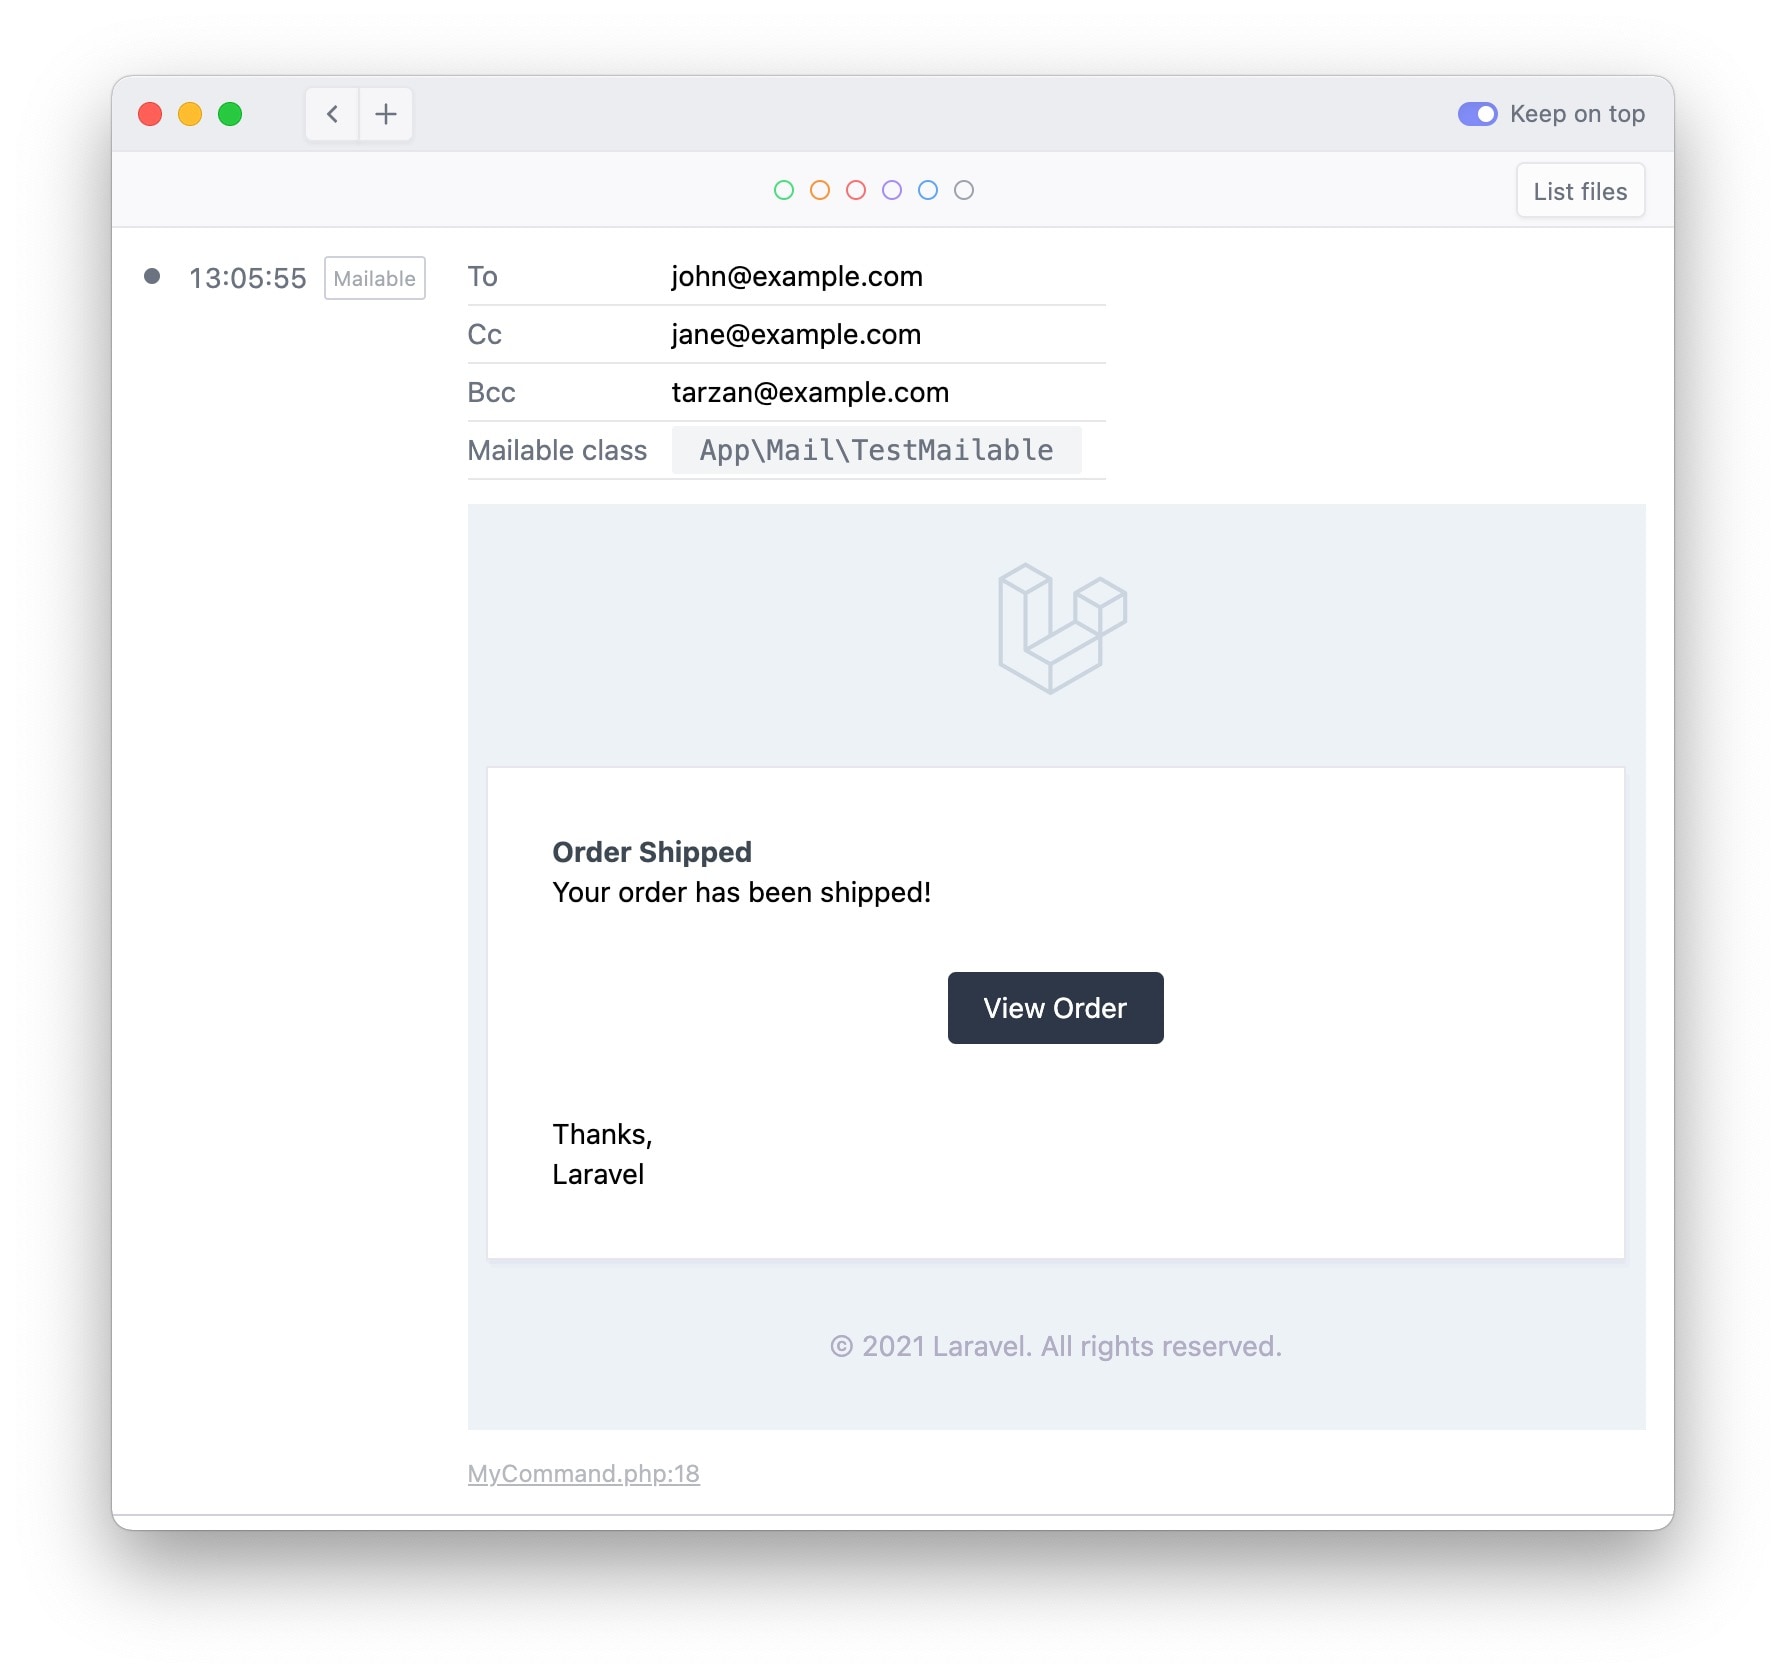
In a fresh Laravel application, any mails you send are written to the log file (as the log driver is the default mail driver). Here's a cool feature: whenever Ray detects that a mail is written to the log, it will display that mailable.
// sending any mail when the log mailer is active,
// will render that mail-in Ray.

Mail::to('john@example.com')->send(new MyMailable());
This is what that looks like:
Manually displaying mailables
In addition to displaying logged mails as explained above, you can also manually show a mailable. Just pass a mailable to the mailable function.
ray()->mailable(new MyMailable());
Displaying collections
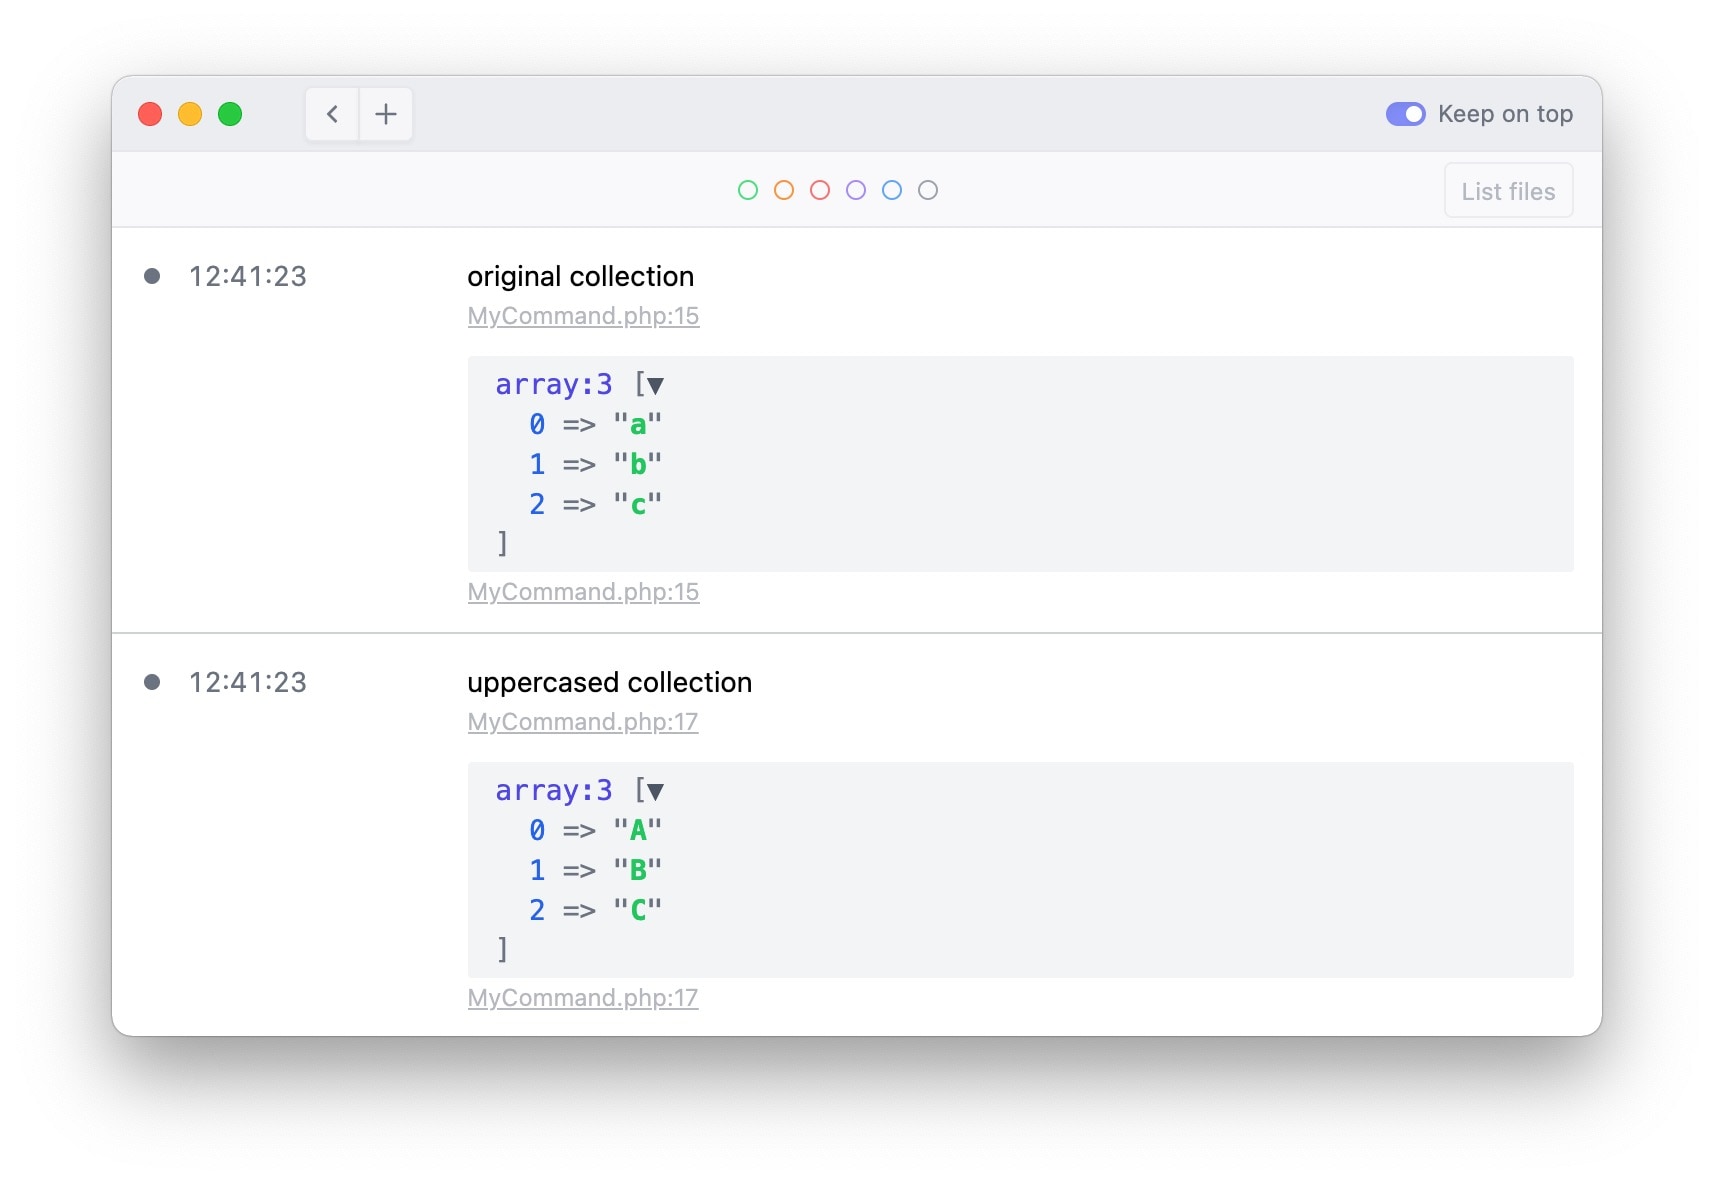
In a Laravel app, Ray will automatically register a ray collection macro to send collections to Ray easily.
collect(['a', 'b', 'c'])
    ->ray('original collection') // displays the original collection
    ->map(fn(string $letter) => strtoupper($letter))
    ->ray('uppercased collection') // displays the modified collection
Using Ray in Blade views
You can use the @ray directive to send variables to Ray from inside a Blade view easily. You can pass as many things as you'd like.
{{-- inside a view --}}

@ray($variable, $anotherVariables)
Showing events
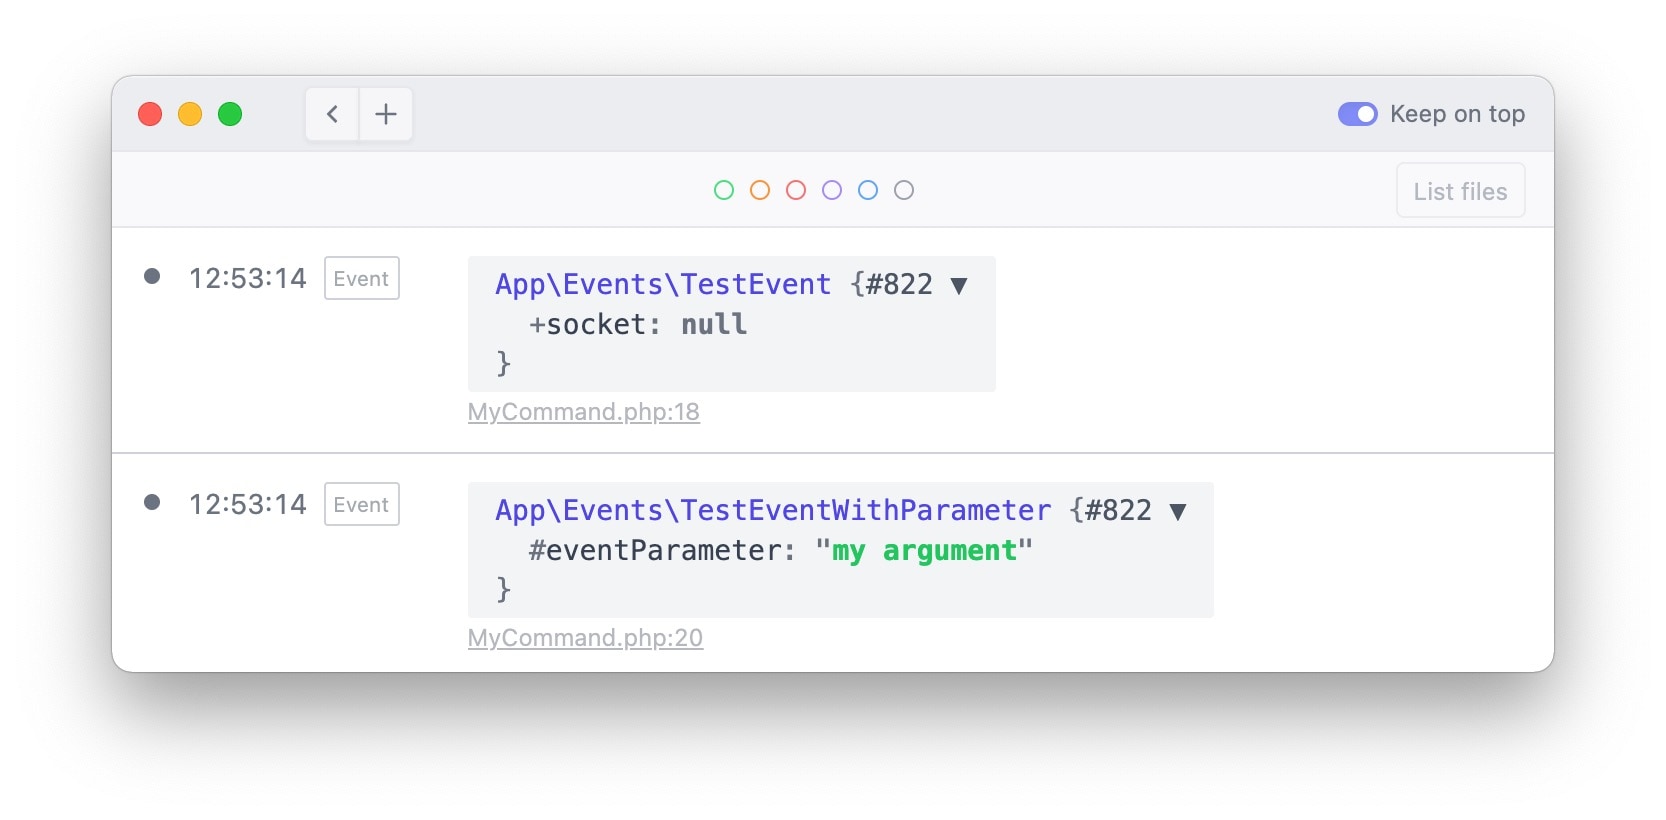
You can display all events that are executed by calling showEvents.
ray()->showEvents();

event(new TestEvent());

event(new TestEventWithParameter('my argument'));
To stop showing events, call stopShowingEvents.
ray()->showEvents();

event(new MyEvent()); // this event will be displayed

ray()->stopShowingEvents();

event(new MyOtherEvent()); // this event won't be displayed.
Alternatively, you can pass a callable to showEvents. Only the events fired inside that callable will be displayed in Ray.
event(new MyEvent()); // this event won't be displayed.

ray()->showEvents(function() {
    event(new MyEvent()); // this event will be displayed.
});

event(new MyEvent()); // this event won't be displayed.
In closing
There are a couple of things Ray can do, such as quickly displaying a class name, conditionally logging stuff, that are not mentioned in this blog post. Head over to the Ray docs to learn more.
I'm very proud of Ray. What started out as the laravel-log-dumper package has become a very polished debugging experience for pragmatic developers. This isn't an app that was quickly slapped together in a couple of days. We've been using it for months, and our team has continously improved it. There are lots of little design details that could deserve a blog post of their own. In the next few months I plan on sharing how some of the internals work.
When I need to display a single value, or debug a straightforward problem quickly, I still find myself using dump. But when the solution is not immediately apparent, or when I need to debug in multiple files, I quickly turn to Ray. Once you're used to the niceties that Ray has to offer, you won't want to go back.
You can test out Ray by downloading the free demo on our website. In our docs, you'll learn how to install the ray or Laravel-ray package in your project.
The demo version of Ray allows you to send ten items per session to Ray. To send more things per session, you can pick up a license. At the time of writing, we're running a cool promo that allows you to save a couple of bucks.
Our team has a couple of neat ideas that we'll add to the app soon. In the current version of Ray, we've added stuff that we needed while debugging ourselves. If you would like to propose something, feel free to create a discussion in the Q&A category on the spatie/ray repo.
I hope that you'll enjoy Ray as much as my team and I have in the past few months.