
A Laravel package to monitor the health of your application
I'm proud to announce that we've released a new package called Laravel Health. As the name implies, this package can be used to monitor the health of your Laravel application.
It offers many checks out of the box, and an easy way to create custom checks. When something is wrong, you can get a notification, or view the status on a dashboard.
The package also offers deep integration with Oh Dear, allowing for even more robust monitoring
I want to tell you all about it in this blog post. Let's go!
Are you a visual learner?
In this stream on YouTube, I'll demo all the features of the package and also go over the source code.
Why and how to monitor a Laravel app
Hopefully, your Laravel app will run fine most of the time. Chances are that, like any other app, your app will at some point run into problems and not function anymore as expected. Maybe your hosting service will go down, or your SSL certificate expires, which makes your entire app unreachable. Or the problems might originate from the app itself: you might have introduced an app breaking bug, or maybe one of the services you depend on is down.
A problem can also be caused by something silly as pausing your Horizon queues and forgetting to unpause them, resulting in no queued jobs being performed. This actually happened to me once.
You want to monitor your app for these kinds of problems automatically so that you can fix them very faster. Hopefully, even before one of your users notices there is something wrong.
There are two ways of monitoring a Laravel app, or any app in general: black box and white box monitoring.
Black box monitoring means monitoring from the outside. The most traditional test is letting a service (like Oh Dear and many others, ...) send a request to your app regularly. If your app doesn't respond with a successful HTTP code, then the service will conclude that your app is down.
For simple websites, black-box monitoring may be enough. But if you're running a more sizeable app, you could also consider white box monitoring. This is monitoring from inside of your server / application. Usually, the things that are being monitored aren't user-facing.
To enable white box monitoring, there usually is some agent that needs to be installed (a well-known example of this would be New Relic). That agent will keep an eye on your app.
Services like New Relic are pretty powerful; they can measure many things. If you need very detailed monitoring and performance tracking, using such a service is probably a good idea.
Having to install an agent for having simple application monitoring always felt a little bit heavy to me. Also, it isn't easy to add custom checks inside of such an agent.
Wouldn't it be nice if the checks were written in PHP?
Introducing Laravel Health
Laravel Health is a package that makes monitoring various aspects of your app very easy.
Using this package, you can register one of the available health checks.
Here's a simple example of monitoring used disk space via the UsedDiskSpaceCheck.
// typically, in a service provider

use Spatie\Health\Facades\Health;
use Spatie\Health\Checks\Checks\UsedDiskSpaceCheck;

Health::checks([
    UsedDiskSpaceCheck::new()
        ->failWhenUsedSpaceIsAbovePercentage(80);
]);
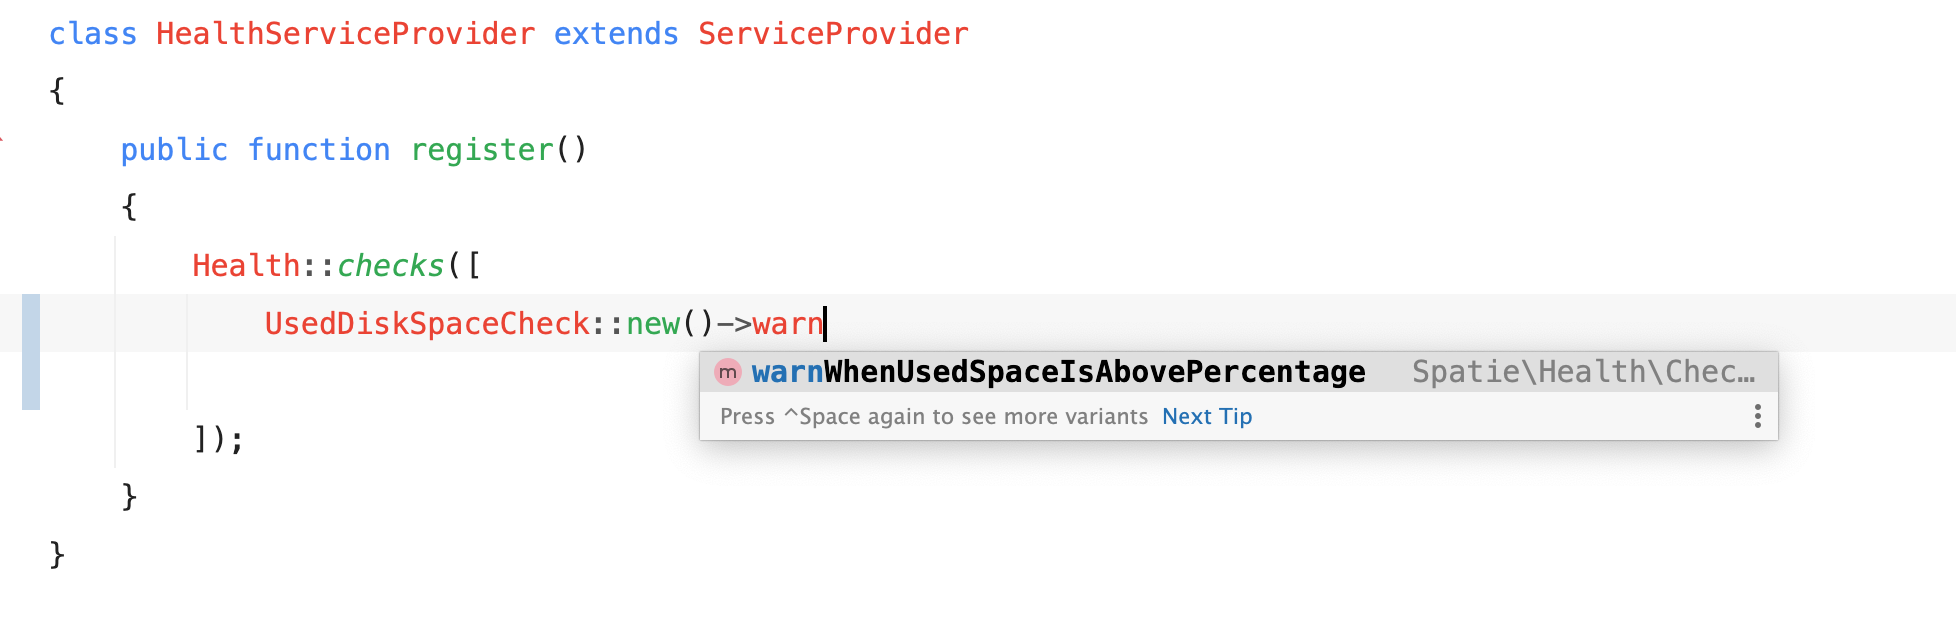
Unlike some alternatives, there's no YAML or JSON file involved to configure checks. A check is a very simple PHP class. You'll get autocompletion on the various customization options when you register them.
All registered checks are executed every minute through a scheduled command.
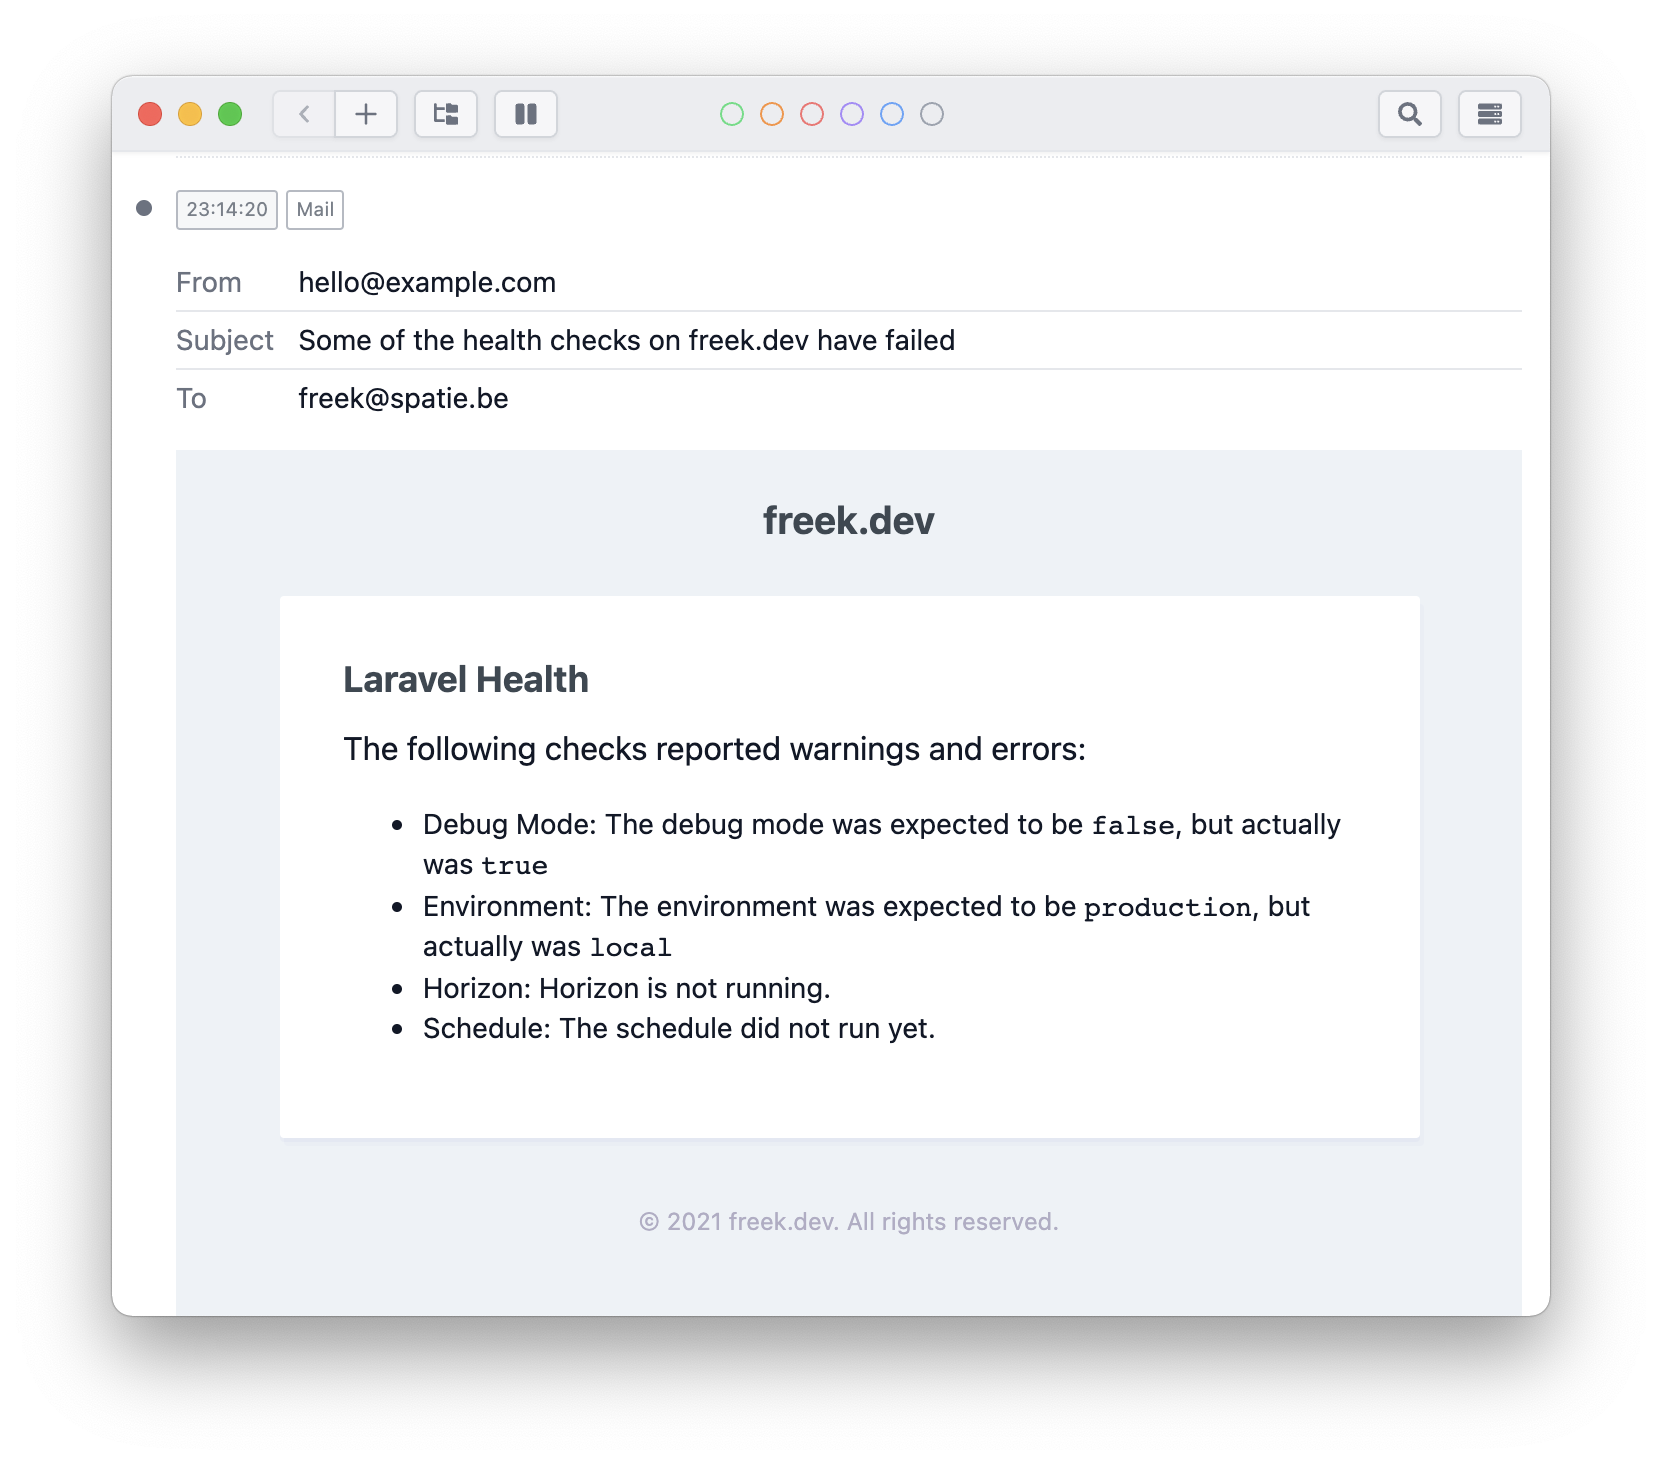
When the used disk space is over 80%, the above UsedDiskSpaceCheck check will fail. When a check fails, trigger an in-application event, so you can execute whatever logic you'd like. The package also has built-in support to send notifications via mail and Slack. By default, notifications are throttled to one per hour, so you don't get swamped when something goes wrong with your app.
Here's how a mail notification looks like (rendered via Ray).
You can start monitoring in only a few minutes by installing the package. Besides checking disk space, the package has more checks and features. Let's dig deeper.
Available checks
I'm already using the health package to monitor this very blog you are reading. The code of freek.dev is open source. The health checks in my app are registered in the HealthServiceProvider.
class HealthServiceProvider extends ServiceProvider
{
    public function register()
    {
        Health::checks([
		    CpuLoadCheck::new()->failWhenLoadIsHigherInTheLast5Minutes(2.0),
            DebugModeCheck::new(),
            EnvironmentCheck::new(),
            DatabaseCheck::new(),
            HorizonCheck::new(),
            UsedDiskSpaceCheck::new()
                ->warnWhenUsedSpaceIsAbovePercentage(90)
                ->failWhenUsedSpaceIsAbovePercentage(95),
            ScheduleCheck::new()->heartbeatMaxAgeInMinutes(2),
            FlareErrorOccurrenceCountCheck::new()
                ->projectId(config('services.flare.project_id'))
                ->apiToken(config('services.flare.api_token'))
        ]);
    }
}
Here's what those health checks will do:
-
CpuLoadCheck: will warn you when the average load on the CPU is higher than it should be -
DebugModeCheck: on a server you should never have debug mode enabled, as it will expose sensitive data. This check will fail when debug mode is nottrue. -
EnvironmentCheck: this check makes sure thatenvironmentis set toproduction. -
DatabaseCheck: will make sure that your database connection is working -
HorizonCheck: makes sure that horizon is running and its status is not set to paused -
UsedDiskSpaceCheck: will warn you when disk space is running low -
ScheduleCheck: this one will send a notification when it detects your scheduled commands are not running correctly. -
FlareErrorOccurrenceCountCheck: this check uses the Flare API to keep an eye on the number of errors that occur in your app. If it's over a specific amount, you'll get a notification.
Adding checks is very easy (I'll get to that in a bit), so I can imagine that by the time you are reading this, more checks will have been added by my colleagues, the community or myself. Check out all available checks in our docs.
Creating a custom check
One of the significant features of the health package is how easy it is to create and use custom checks.
A check is any class that extends from Spatie\Health\Checks\Check. It contains one abstract method that you should implement: run.
namespace App\Checks;

use Spatie\Health\Checks\Check;
use Spatie\Health\Checks\Result;

class YourCustomCheck extends Check
{
    public function run(): Result
    {
        // your custom logic...
    }
}
Inside of that Run method, you can perform any checking logic you want. This method should always return a Spatie\Health\Checks\Result. Using this object, you can instruct the package to report a failure, send a notification, and add meta information.
The Result object has a status to signify a check is ok, produces a warning, or has failed.
$result = Spatie\Health\Checks\Result::make();

$result->ok(); // the check ran ok
$result->warning(); // the check ran ok, but with a warning
$result->fail(); // the check failed
You should call ok() when everything your check verifies is ok. You should call fail() if you detected something wrong. The warning() should be used when the check did pass but might fail soon.
When you pass a string to any of these methods and return that result, the package will send a notification.
$result->fail('Something really bad happened');
Here's an example check that will check for used disk space. A warning notification will be sent when used disk space is above 70%; when above 90%, an error notification will be sent.
namespace App\Checks;

use Spatie\Health\Checks\Check;
use Spatie\Health\Checks\Result;

class UsedDiskSpaceCheck extends Check
{
    public function run(): Result
    {
        $usedDiskSpacePercentage = $this->getDiskUsagePercentage();

        $result = Result::make();

        if ($usedDiskSpacePercentage > 90) {
            return $result->failed("The disk is almost full ({$usedDiskSpacePercentage} % used)");
        }

        if ($usedDiskSpacePercentage > 70) {
            return $result->warning("The disk getting full ({$usedDiskSpacePercentage}% used)");
        }

        return $result->ok();
    }

    protected function getDiskUsagePercentage(): int
    {
        // determine used disk space, omitted for brevity
    }
}
Optionally, you can add a short summary of what the check found using the shortSummary method.
namespace App\Checks;

use Spatie\Health\Checks\Check;
use Spatie\Health\Checks\Result;

public function run(): Result
{
    $usedDiskSpacePercentage = $this->getDiskUsagePercentage();

    $result = Result::make();

    $result->shortSummary("{$usedDiskSpacePercentage}%")

    // ...
}
The summary can be used when displaying all the results on a dashboard. And yes, the package also comes with a built-in dashboard (more on that in a bit).
If you create a check, I highly encourage you to package it up, and add it to the check list in our documentation (there's an edit button on the top of the page). This way, others can make use of your check too.
Take a look at the spatie/cpu-load-health-check package to see a good example of how you can package up a check. If you don't know how to create a package, you can learn it in a couple of hours by watching the Laravel Package Training.
Viewing check results
Whenever a check fails, you'll get a notification. But this is not the only way you can see the results of the checks.
During installation, you might have scheduled the RunChecksCommand that will run the checks every minute. That command will also write the checks results in the database or in a JSON file (you can even write your results to external storage, like S3).
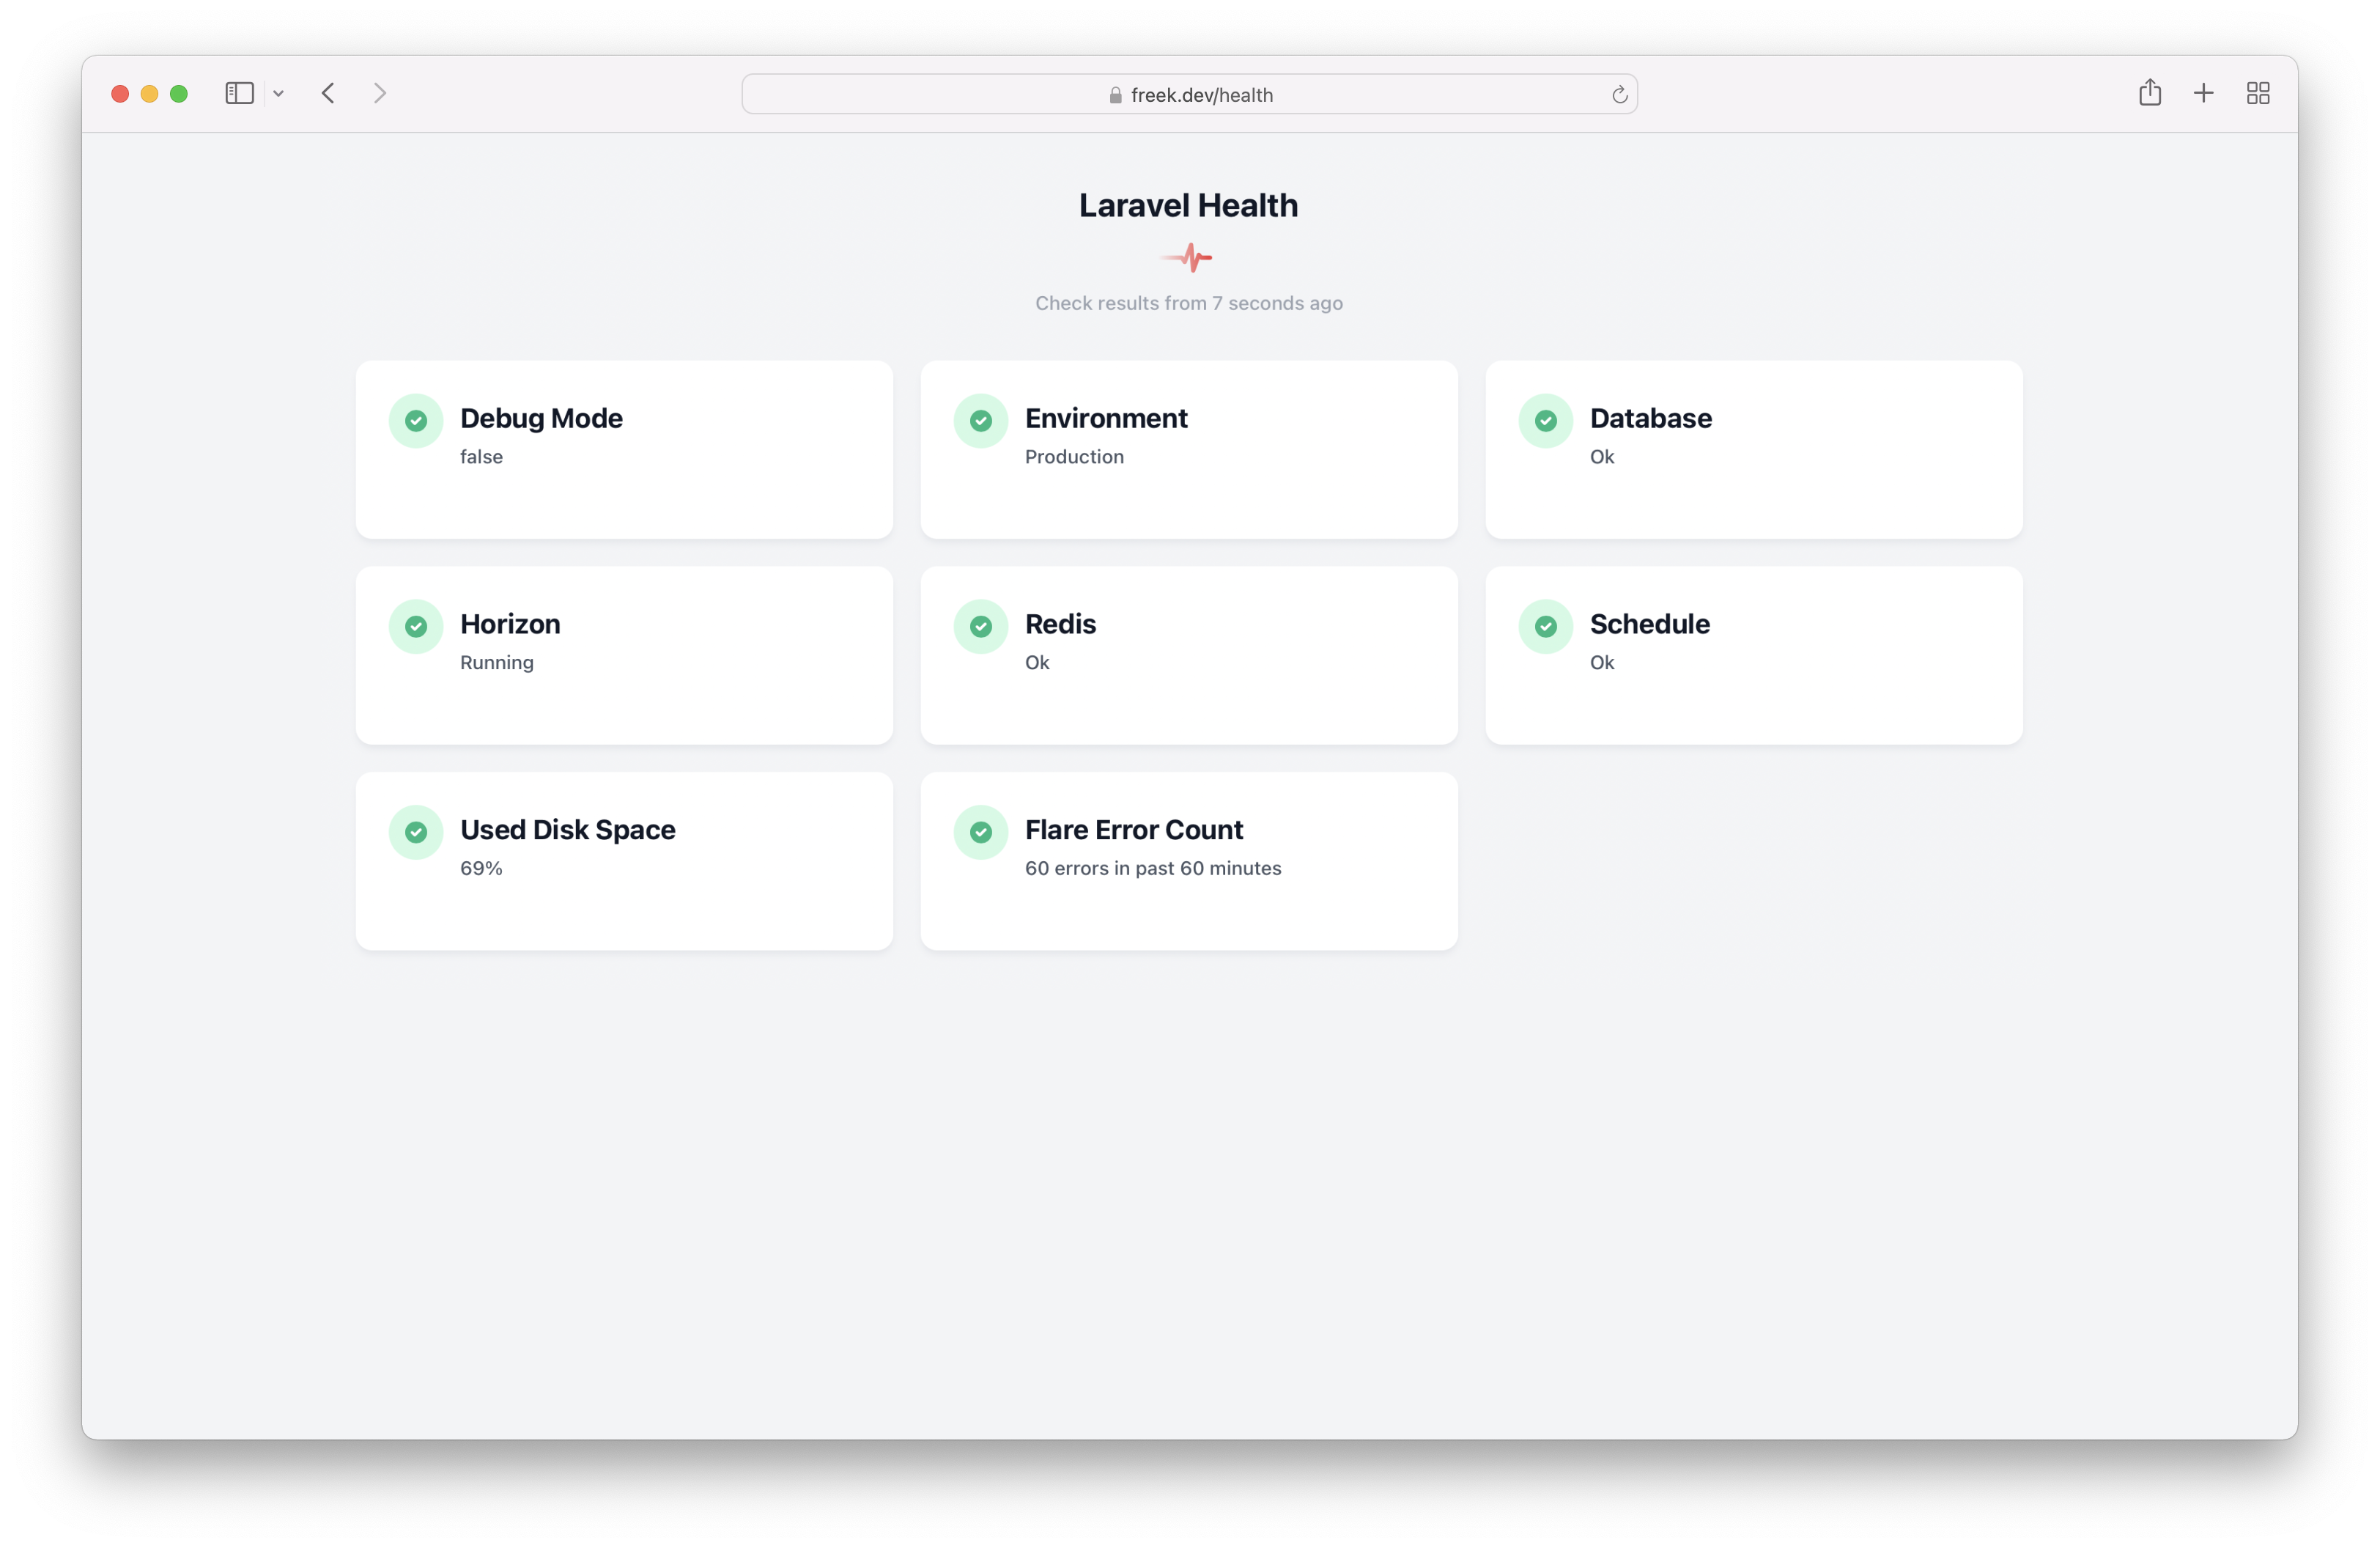
Laravel Health comes with a simple dashboard out of the box to view those stored results. On the dashboard, you'll see a bird's eye view of the health of your app.
The dashboard also looks beautiful in dark mode.
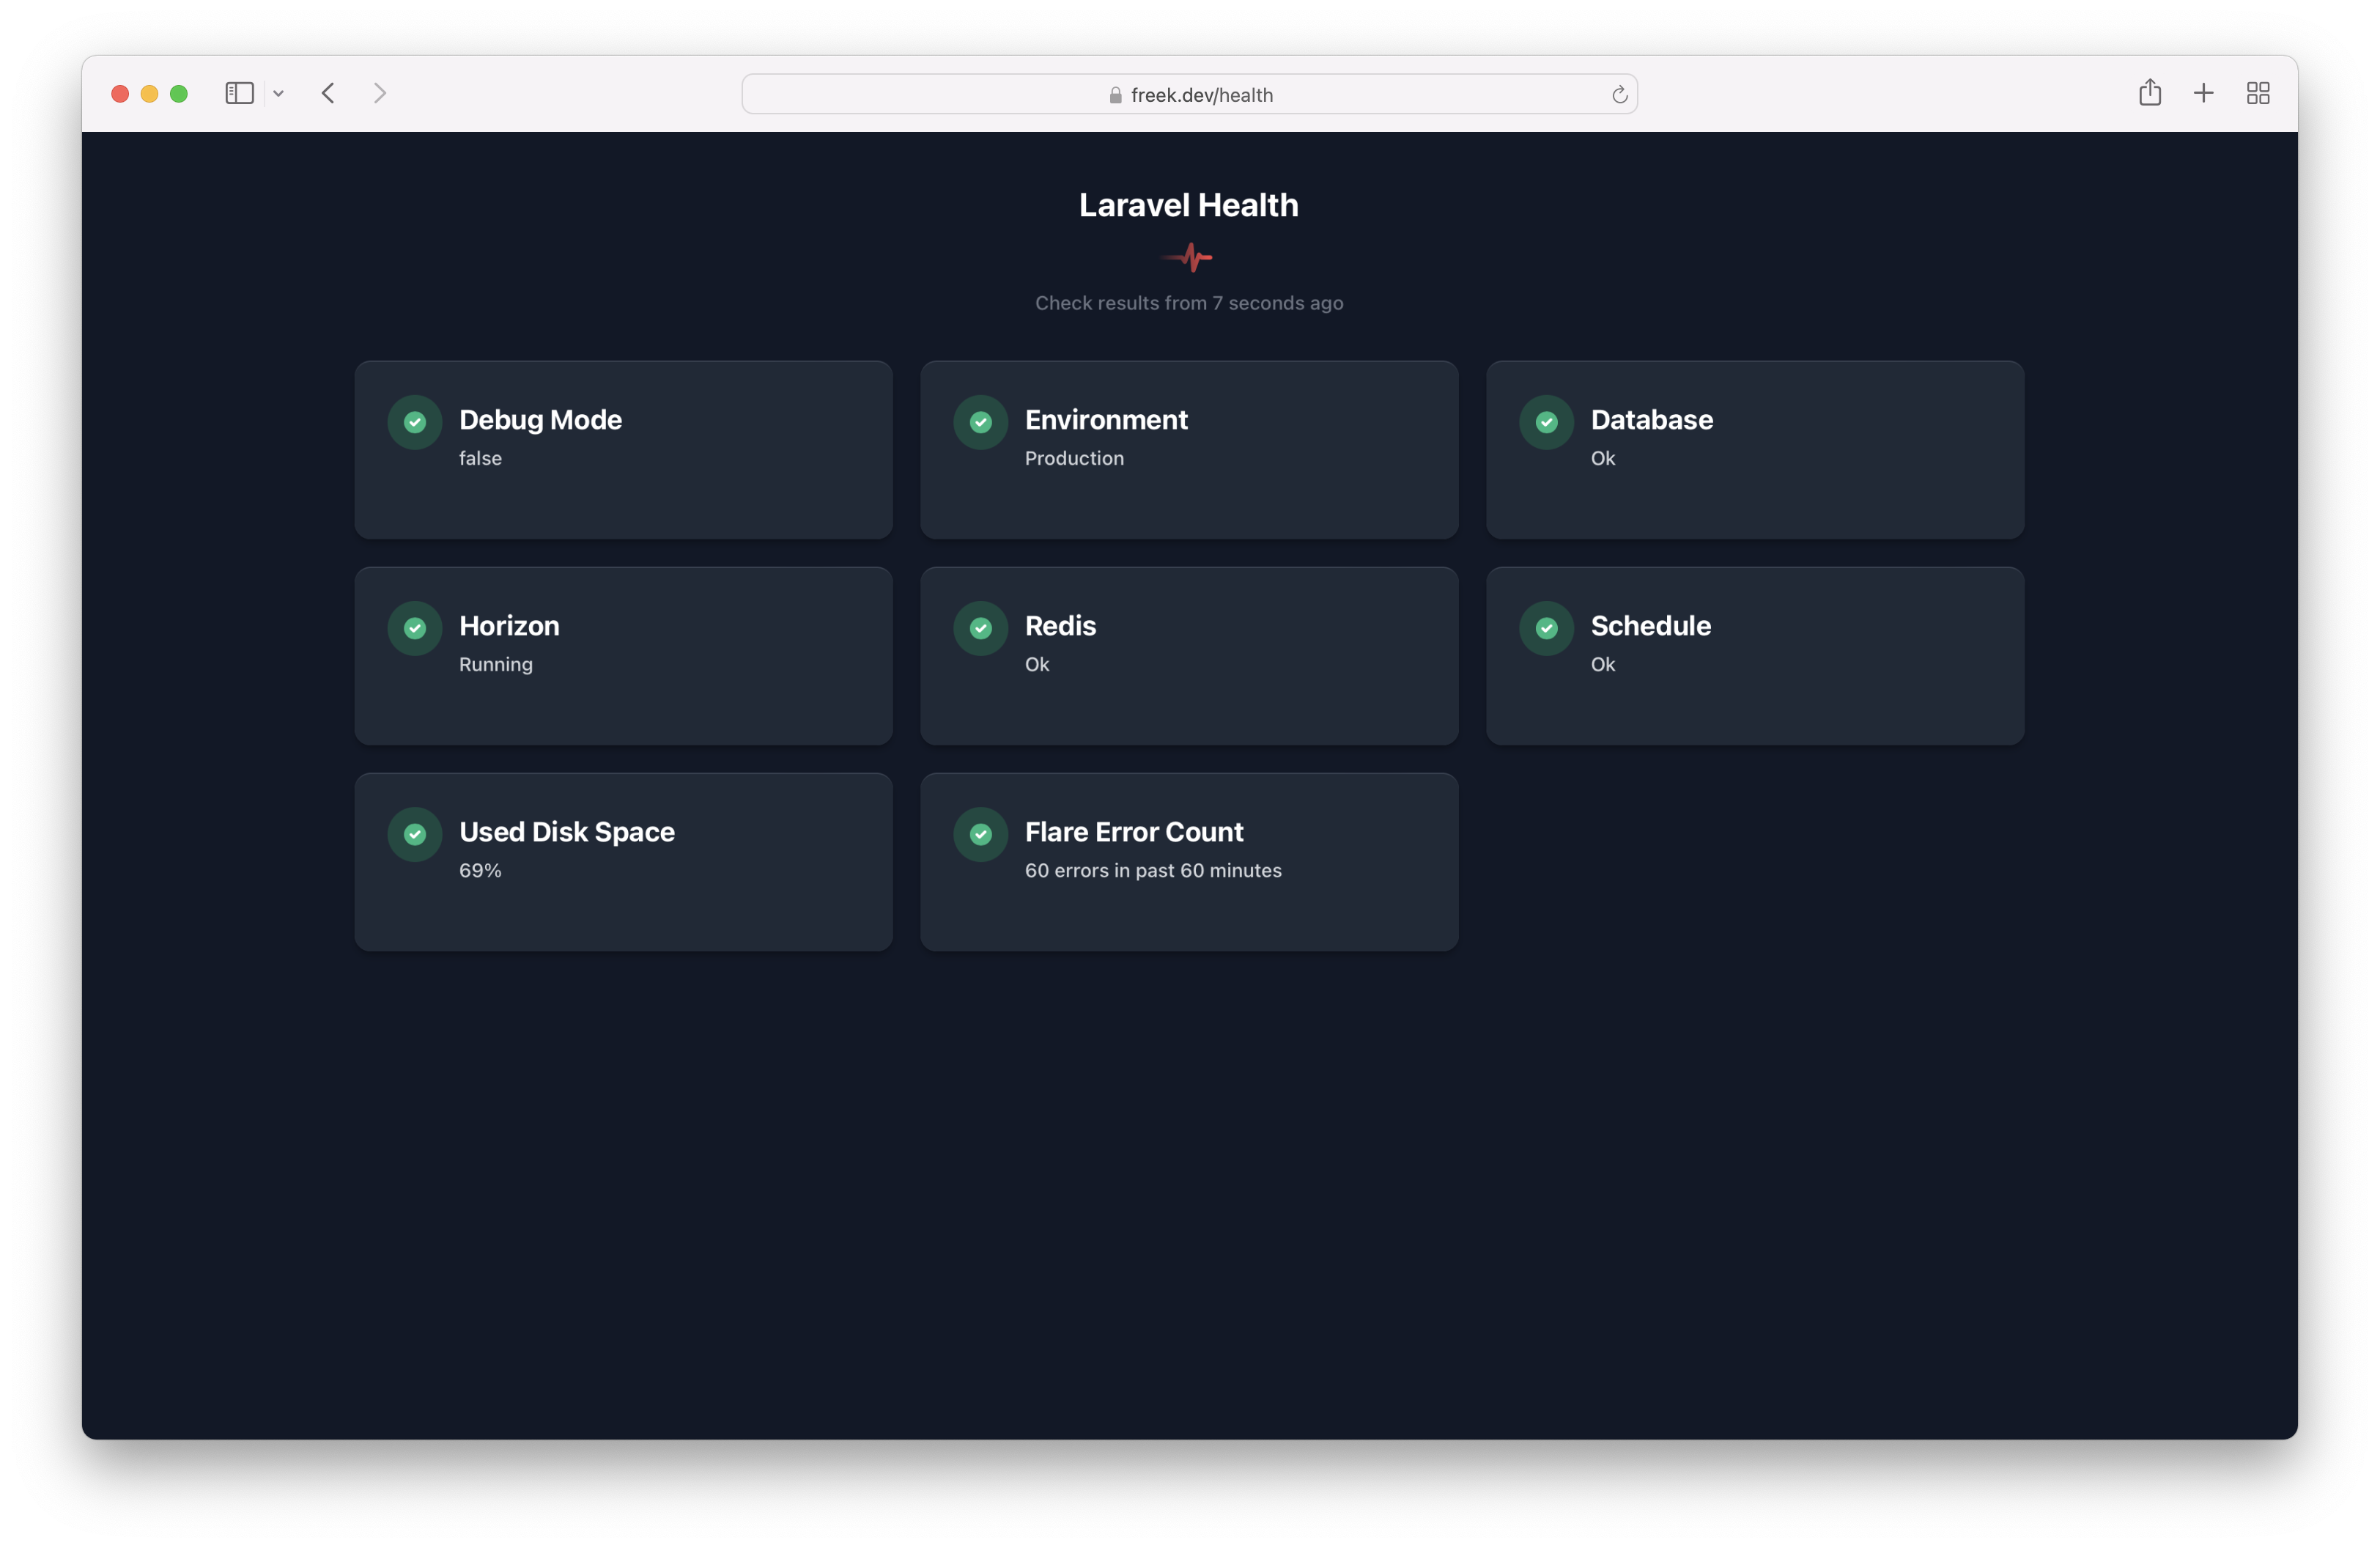
The styling of the dashboard was contributed by Nick Retel who did an awesome job.
Because a scheduled command performs checks, the results might be 59 seconds old. To run all the checks before rendering the dashboard, you can pass the fresh query parameter.
https://example.com/health?fresh
This way, you'll see the newest results on the dashboard.
You can make tweaks to the dashboard by publishing the views of the package, which can be done with this command:
php artisan vendor:publish --tag=health-views
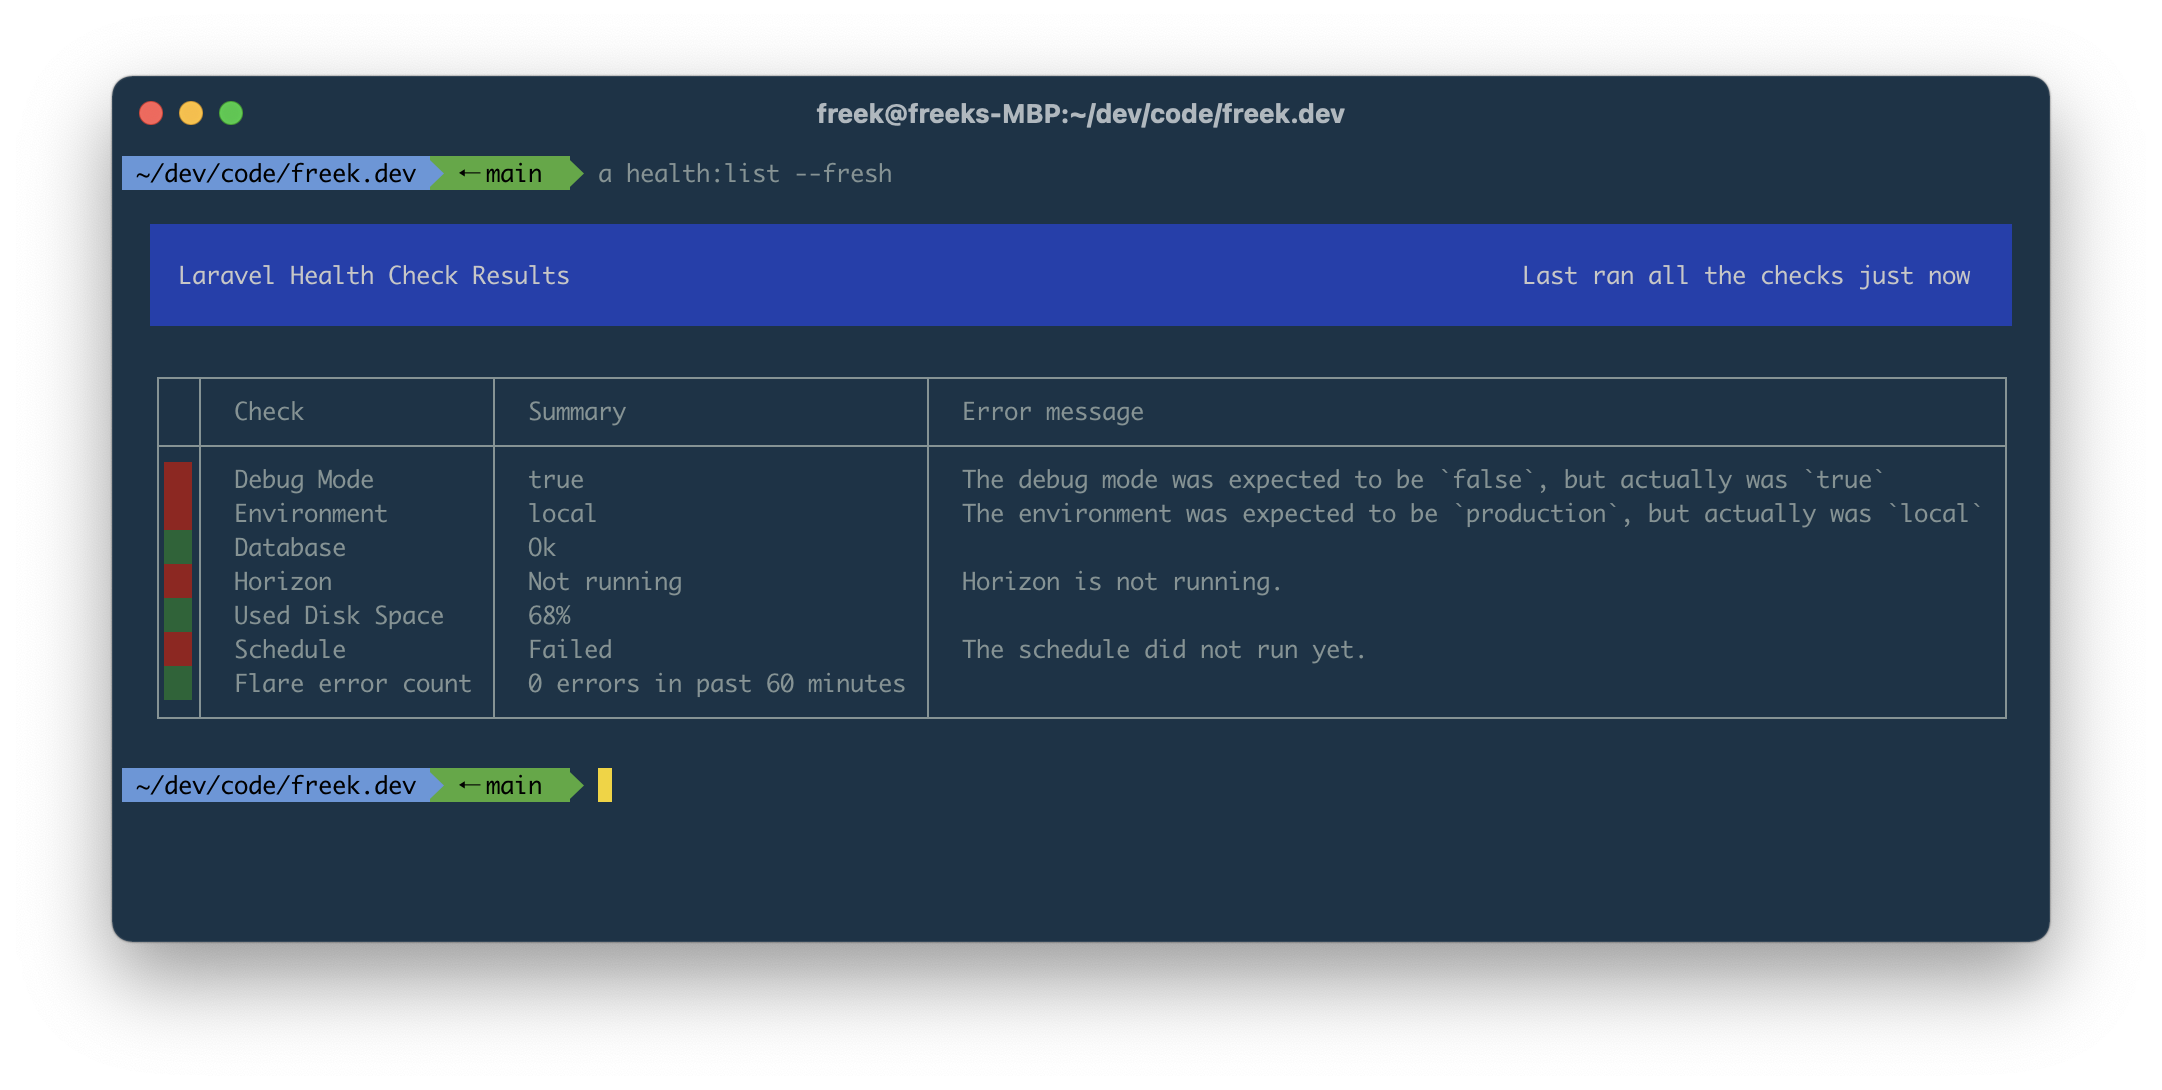
There's also another way to view results, and that is via the CLI. To view the results of all checks, you can run this artisan command:
php artisan health:list
Here's how it looks like:
A thank you to Francisco Madeiro for his help making this pretty.
If you want to first execute all the checks, so you'll see fresh results, add the fresh option.
php artisan health:list --fresh
Under the hood, this list command uses Termwind. This package allows you to use TailwindCSS classes to style CLI output. You can even use a Blade view which is pretty mind-blowing to me.
Here's the Blade view that renders that CLI output in the screenshot above.
<div class="mx-2 my-1">
    @if(count($checkResults?->storedCheckResults ?? []))
        <div class="w-full text-white text-center bg-blue-800"></div>
        <div class="w-full text-white bg-blue-800">
            <span class="p-2 text-left w-1/2">Laravel Health Check Results</span>
            <span class="p-2 text-right w-1/2">
               Last ran all the checks
                @if ($lastRanAt->diffInMinutes() < 1)
                    just now
                @else
                    {{ $lastRanAt->diffForHumans() }}
                @endif
            </span>
        </div>
        <div class="w-full text-white text-center bg-blue-800 mb-1"></div>

        <table style="box">
            <thead>
            <tr>
                <td></td>
                <td>Check</td>
                <td>Summary</td>
                <td>Error message</td>
            </tr>
            </thead>
            @foreach($checkResults->storedCheckResults as $result)
                <tr>
                    <td class="{{ $color($result->status) }}"></td>
                    <td>{{ $result->label }}</td>
                    <td>{{ $result->shortSummary }}</td>
                    <td>{{ $result->notificationMessage }}</td>
                </tr>
            @endforeach
        </table>
    @else
        <div>
            No checks have run yet...<br/>
            Please execute this command:

            php artisan health:run --fresh
        </div>
    @endif
</div>
Pretty neat, right? In the ListHealthChecksCommand this view is rendered in very much the same way as you would a regular Blade view.
render(view('health::list-cli', [
    'lastRanAt' => new Carbon($checkResults?->finishedAt),
    'checkResults' => $checkResults,
    'color' => fn (string $status) => $this->getBackgroundColor($status),
]));
Next to the HTML and CLI views, there's also a third way to render health checks results. The package comes with a HealthCheckJsonResultsController that will render the latest results of your check as JSON. The structure of that JSON file is explained in our docs.
Having the results available as JSON will allow another part of your infrastructure to monitor the health of your application. You could, for instance, store the results of the checks to S3 so that those results will still be available even if your entire app goes down.
Instead of trying to monitor the content of that JSON file yourself, you could also let another service do it. Let's take a look at how you can use laravel-health and Oh Dear to monitor the health of your Laravel app.
Monitoring your application from the outside using Oh Dear
In certain scenario's, your application can be in such a bad state that it can't send any notifications anymore. If there's a big problem with your schedule, the checks won't even run anymore.
A possible solution is to let Oh Dear monitor your health checks.
Using Oh Dear for health monitoring unlocks some more options: you'll be able to snooze notifications, you get notified when a check is back healthy again, and there are more delivery channels such as Telegram, Discord, MS Teams, Webhooks, ...
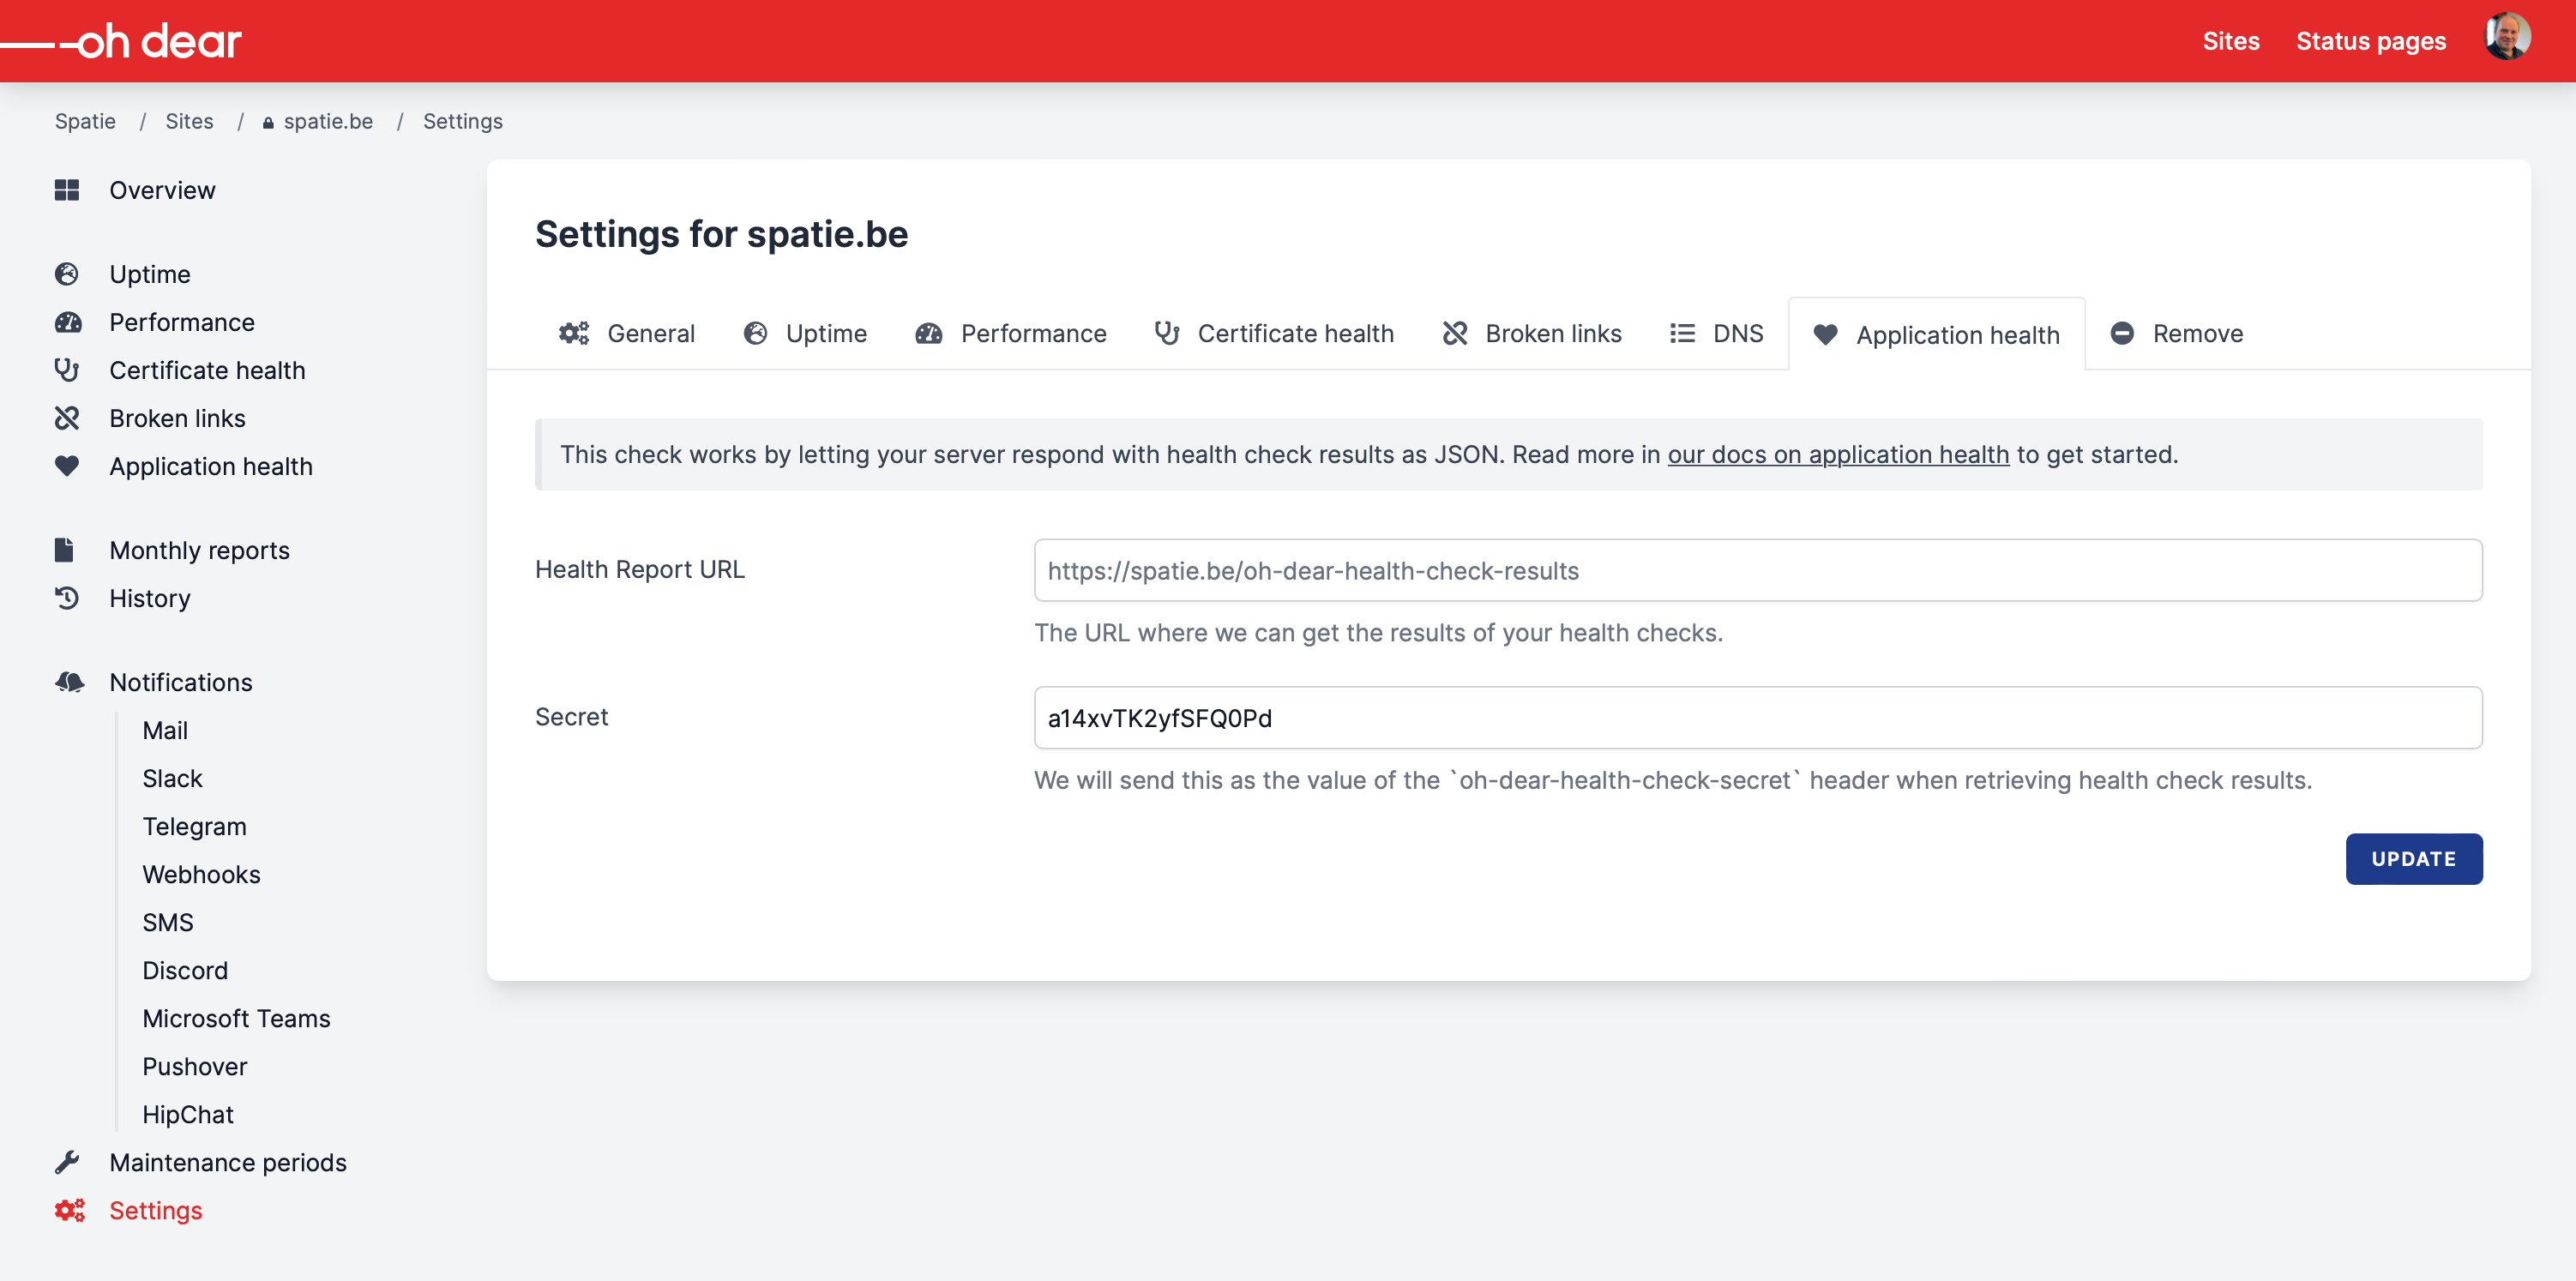
Sending health check results to Oh Dear is very straightforward. In the health config file, you need to enable an HTTP endpoint. On that endpoint, all results of your checks will be readable as JSON. Here's the relevant part of the configuration file. Most options should be self-explanatory.
// in app/config/health.php

/*
 * You can let Oh Dear monitor the results of all health checks. This way, you'll
 * get notified of any problems even if your application goes totally down. Via
 * Oh Dear, you can also have access to more advanced notification options.
 */
'oh_dear_endpoint' => [
    'enabled' => true,

    /*
     * When this option is enabled, the checks will run before sending a response.
     * Otherwise, we'll send the results from the last time the checks have run.
     */
    'always_send_fresh_results' => true,

    /*
     * The secret that is displayed at the Application Health settings at Oh Dear.
     */
    'secret' => env('OH_DEAR_HEALTH_CHECK_SECRET'),

    /*
     * The URL that should be configured in the Application health settings at Oh Dear.
     */
    'url' => '/oh-dear-health-check-results',
],
You should specify the endpoint URL and secret in Oh Dear's application health settings screen.
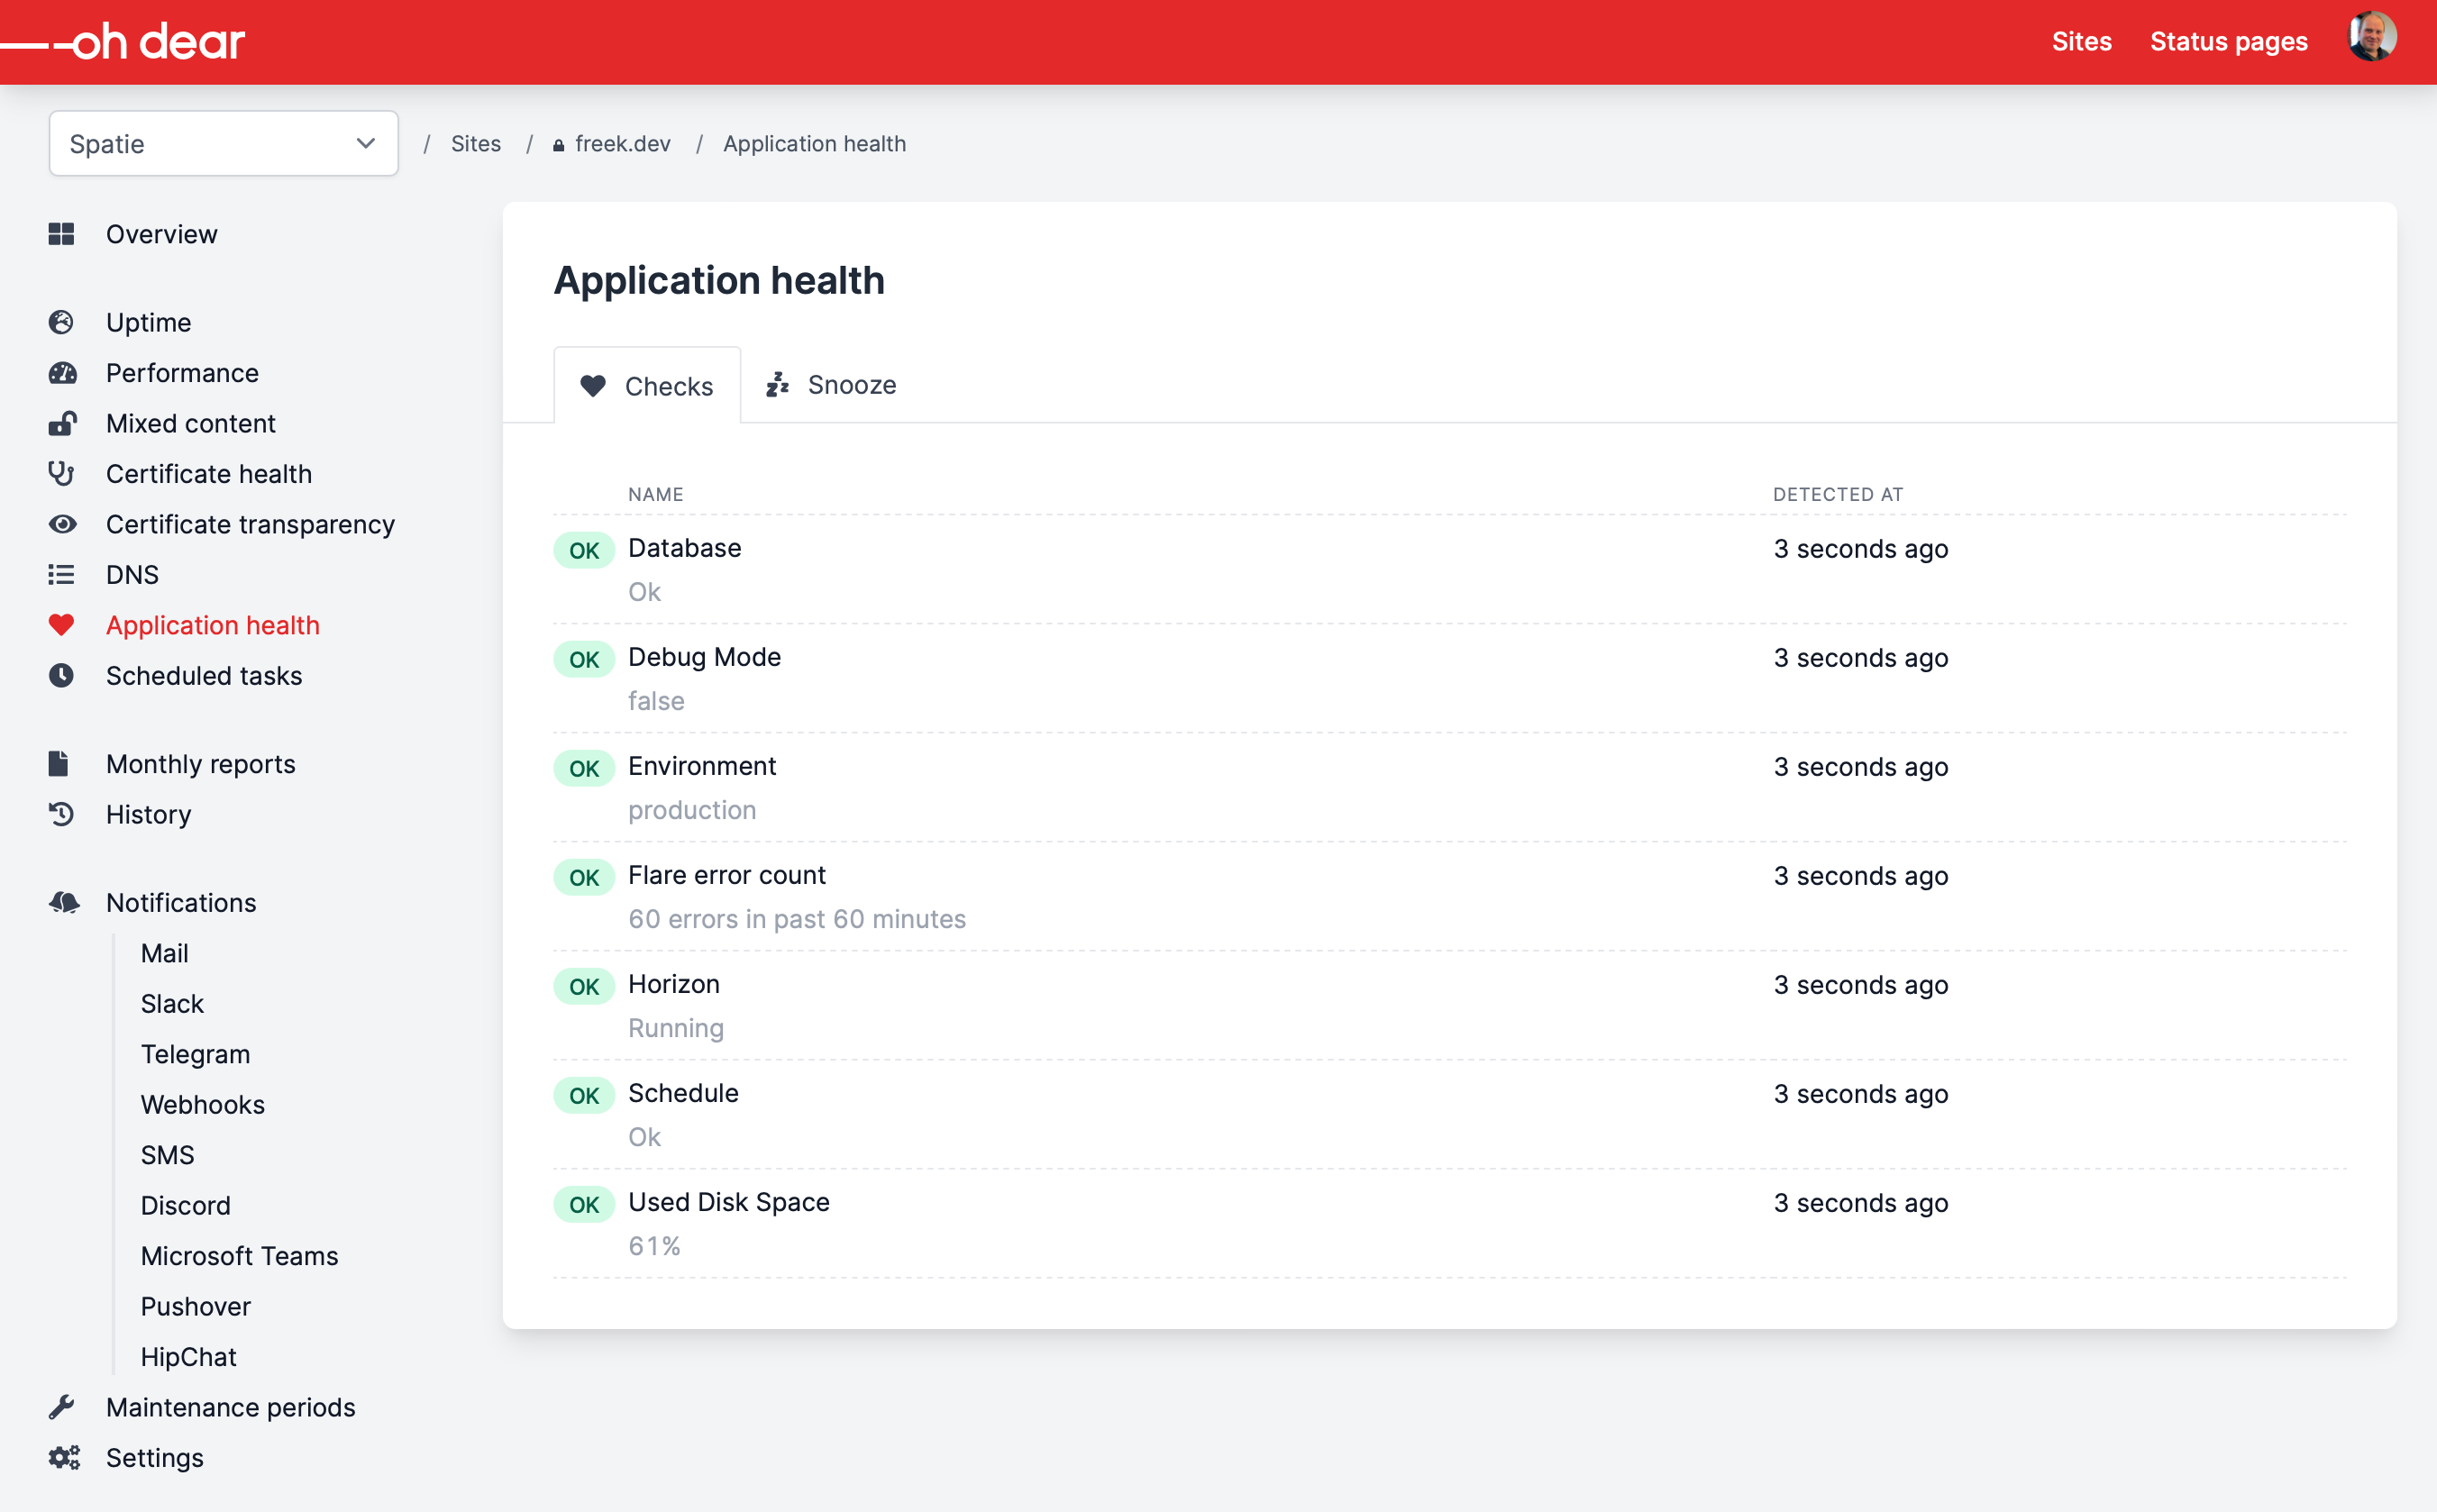
With that out of the way, you can see the health check results in Oh Dear.
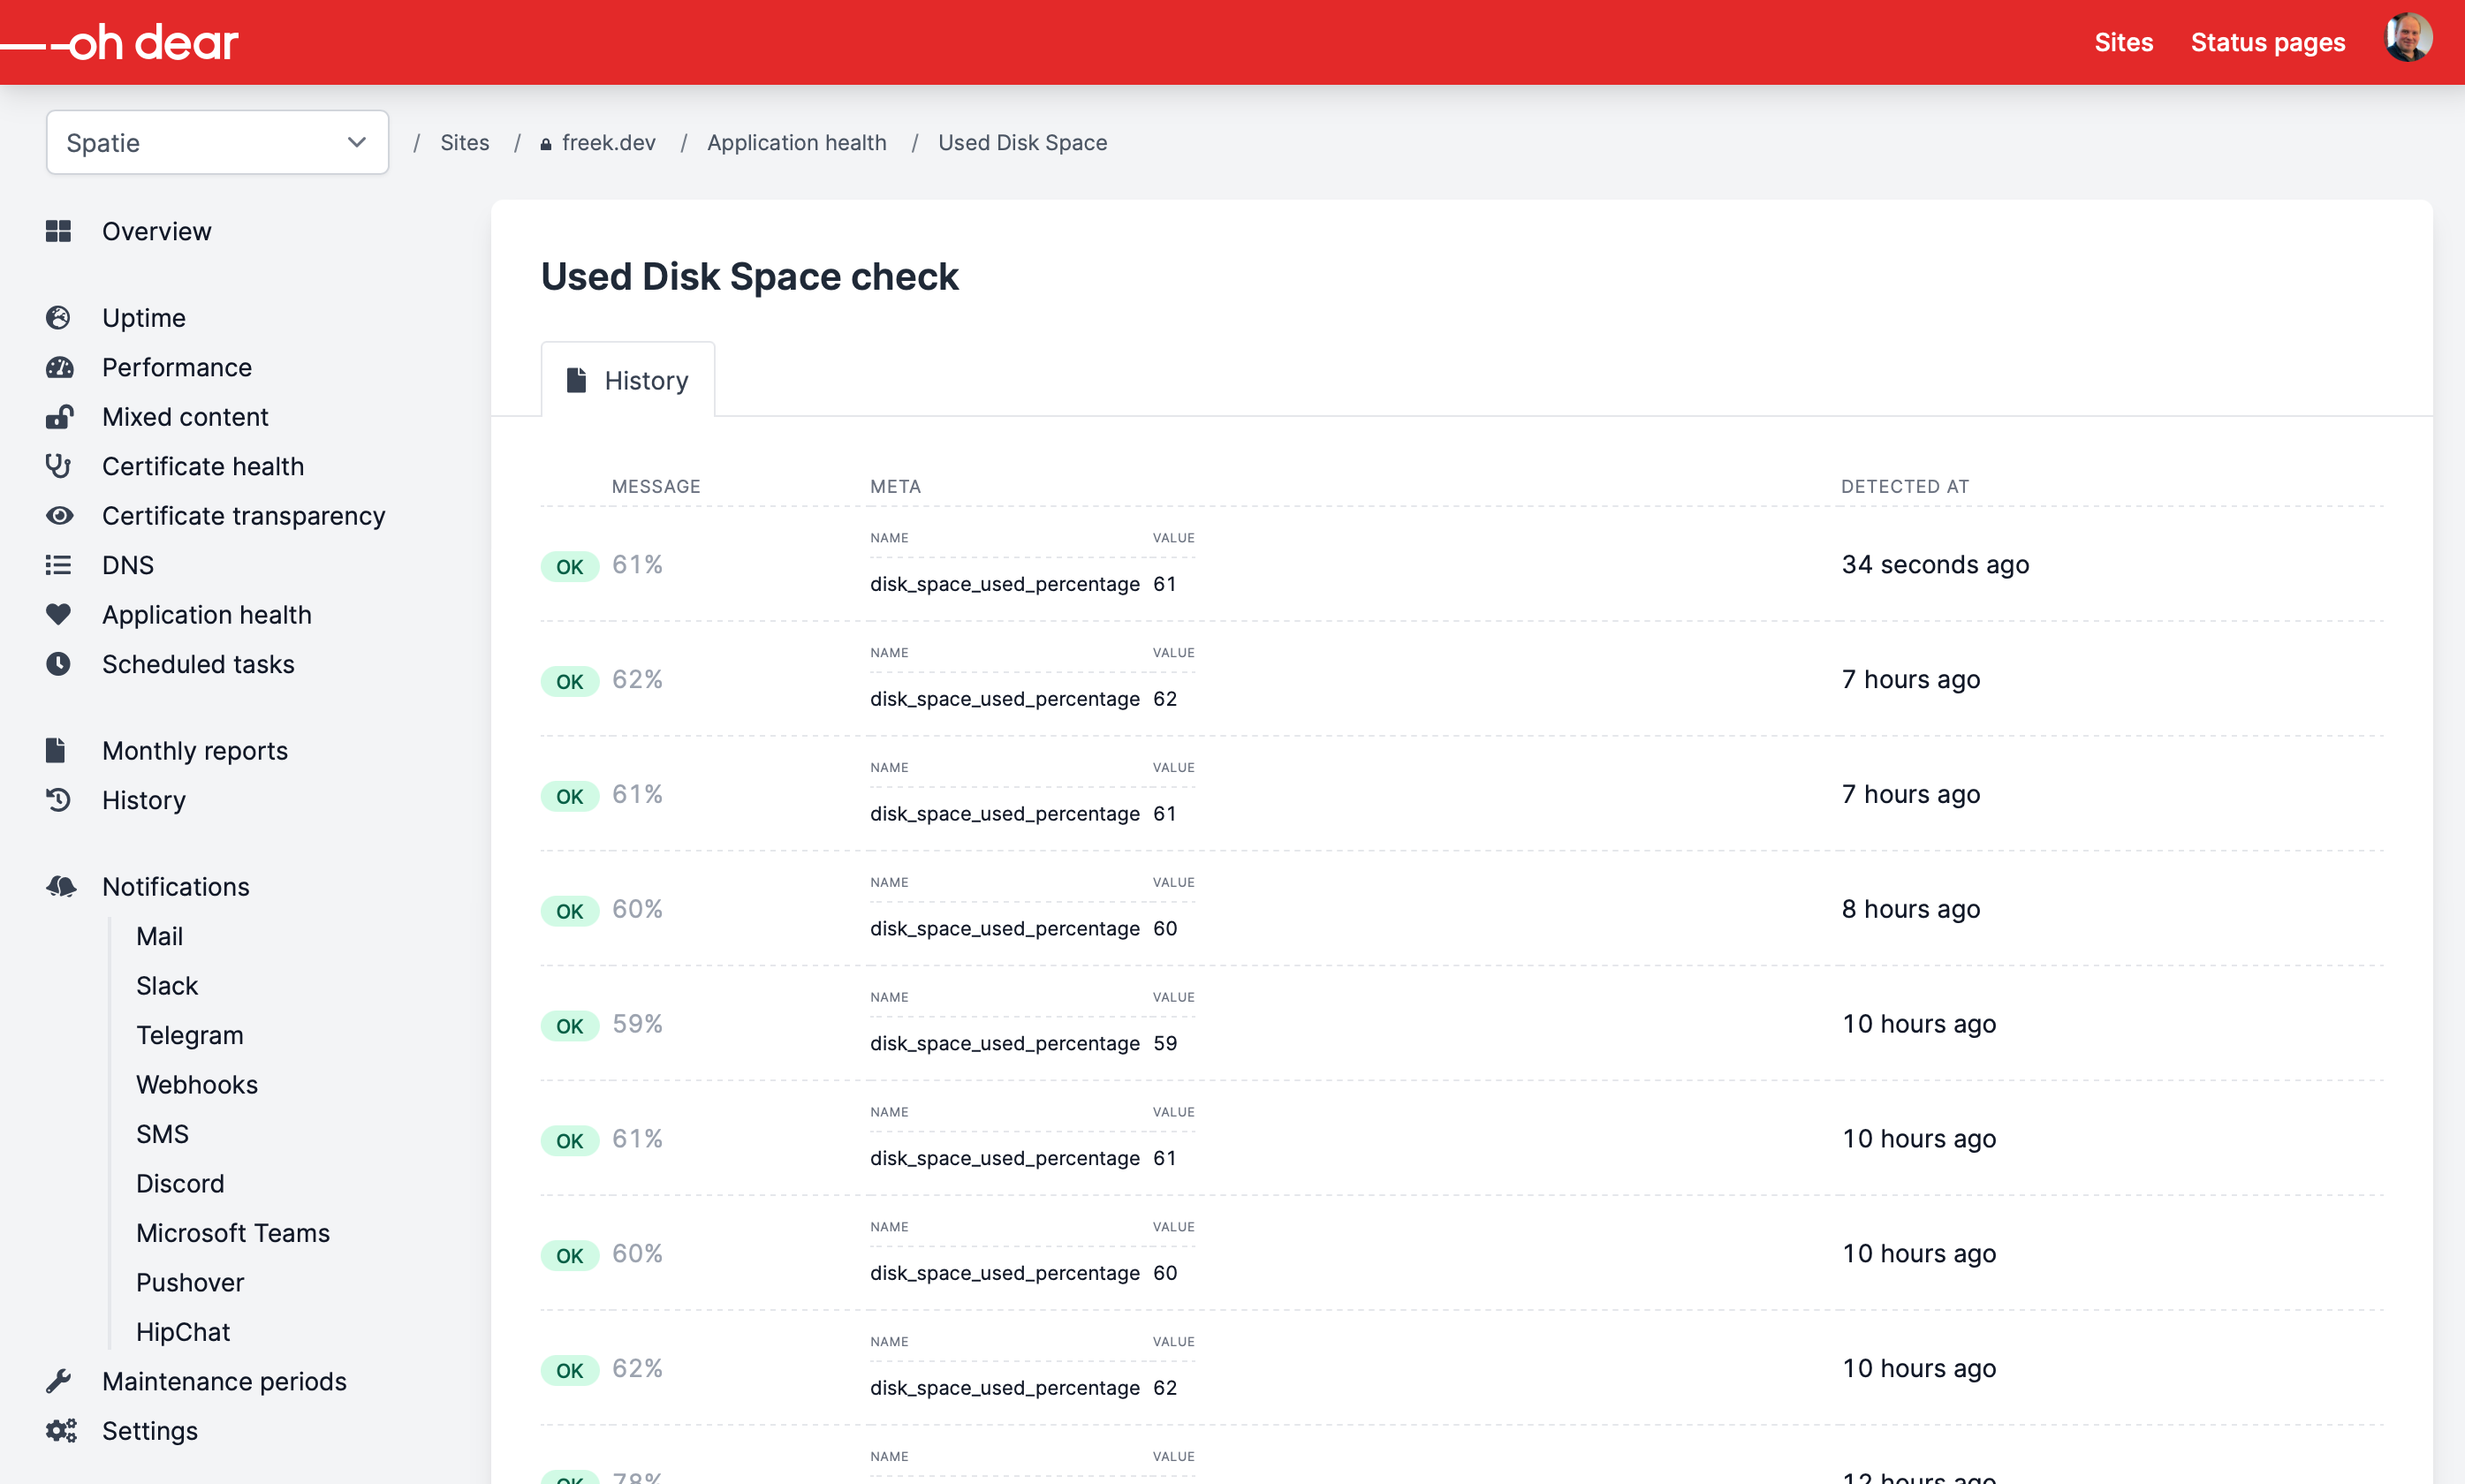
You can also see the history of results for a check.
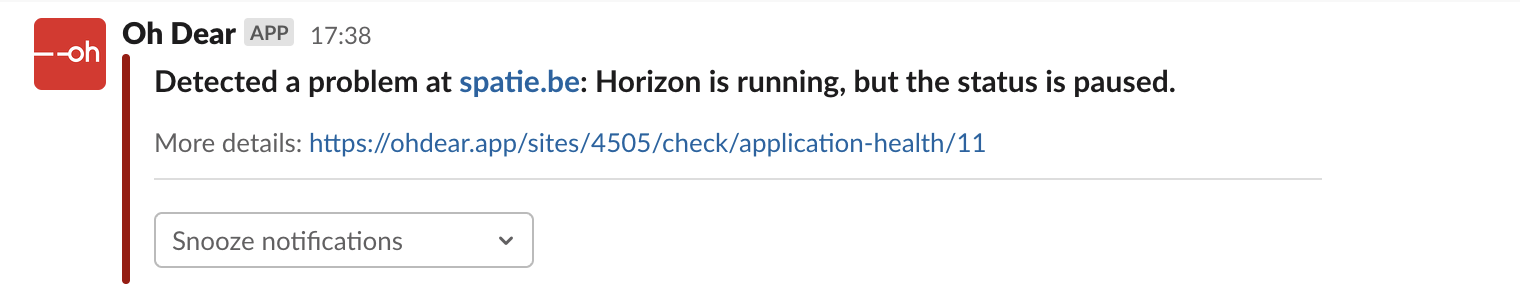
You'll see a notification much like this one when something goes wrong.
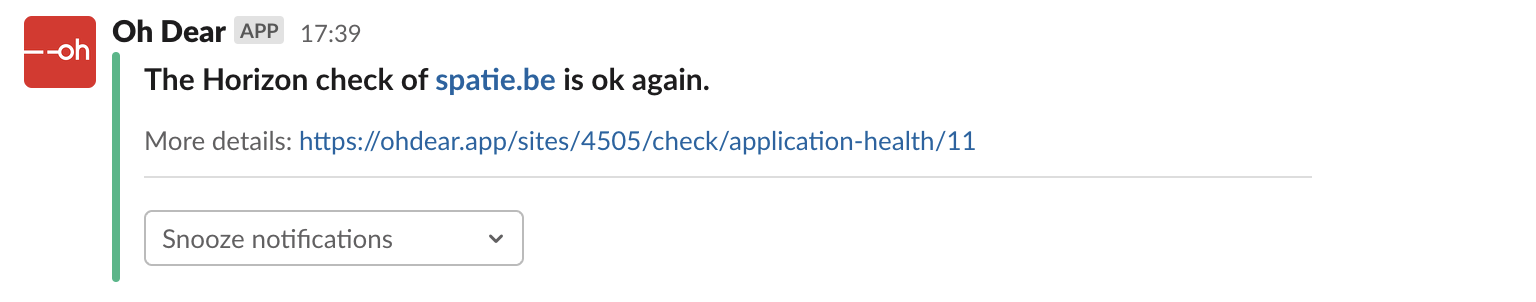
And when the check is getting back in a healthy state, we'll notify you as well.
The Laravel Health package makes sending application health results to Oh Dear very easy. If you want to monitor another kind of PHP application, or even an app written in another language, no problem! Head over to the Oh Dear docs to learn how to do that.
In closing
Laravel Health is probably the most straightforward way to monitor the health of a Laravel app. You don't need to install a funky agent. Instead, you can just install it in your app and add any check that you want.
Right now, the package only has the checks that we needed at Spatie, but we can't wait to see which outstanding checks will be contributed by the community.
The package has some more options that haven't been mentioned here, so check out the extensive documentation for Laravel Health.
This package isn't the first one we've made. On our company website, you'll find an extensive list of all the Laravel and PHP packages we've created. We're pretty sure there's something there for your next project.
Want to support our open source efforts? Then consider picking up one of our paid products, or take a look at the alternative ways to support us.
What are your thoughts on "A Laravel package to monitor the health of your application"?